RTMA Syllabus
RTMA Syllabus, IF's quotes, POLE & FLAG
The RTM FTTP syllabus & IF's General Rule
Price movement
Objectives:
Learn the simple ways ITs move price and the reasons behind why they do
what they do
Learn the common mistakes retail traders make and how this is
beneficial to ITs
Understand how stop hunting helps fill orders
Candles
Objectives:
Define commonly traded candles
Learn the common misconceptions about trading candle patters/individual
candles
Learn how conventional stop placement on trading candle
patters/individual candles can kill your account
Learn what candles mean depending where they form
Real Price Action 1
Objectives:
Define supply/demand and understand that SD traders are subjected to
the same tricks as everyone else
Define support/resistance and learn how it can be such a powerful tool
when used properly
Demonstrate your understanding of poles and flags. Define the strict
rules on what makes a pole and what makes a flag
Real Price Action 2
Objectives:
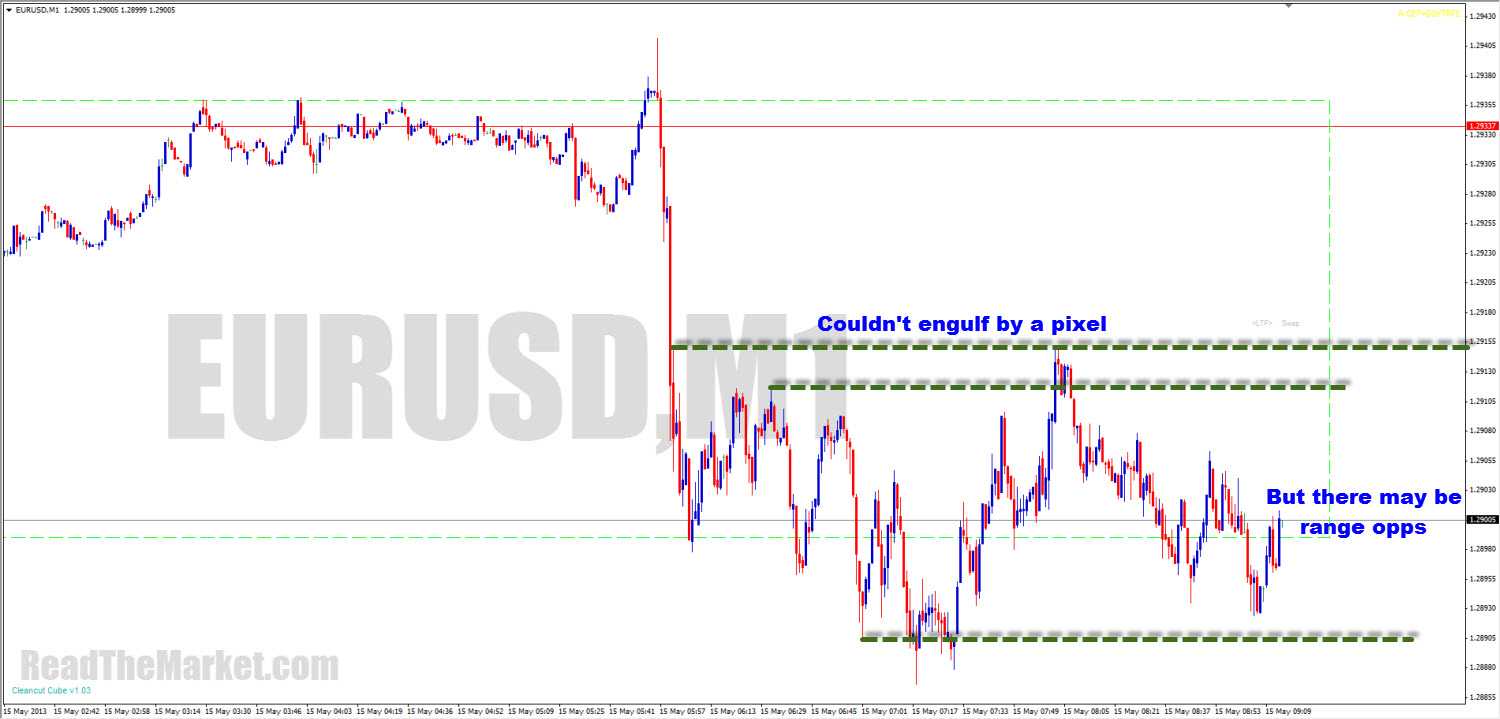
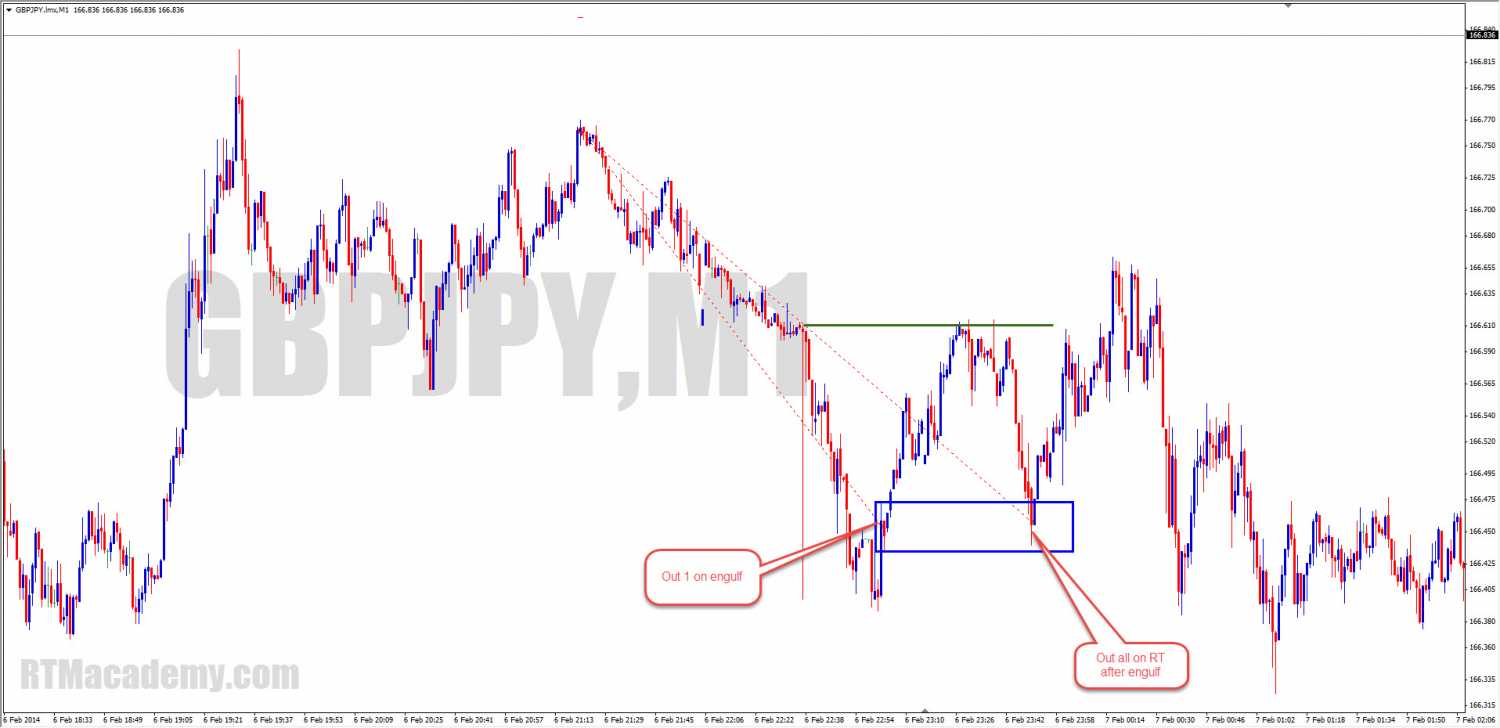
Demonstrate an understanding of the continuation engulf
Demonstrate an understanding of the reversal engulf and where to look
for it
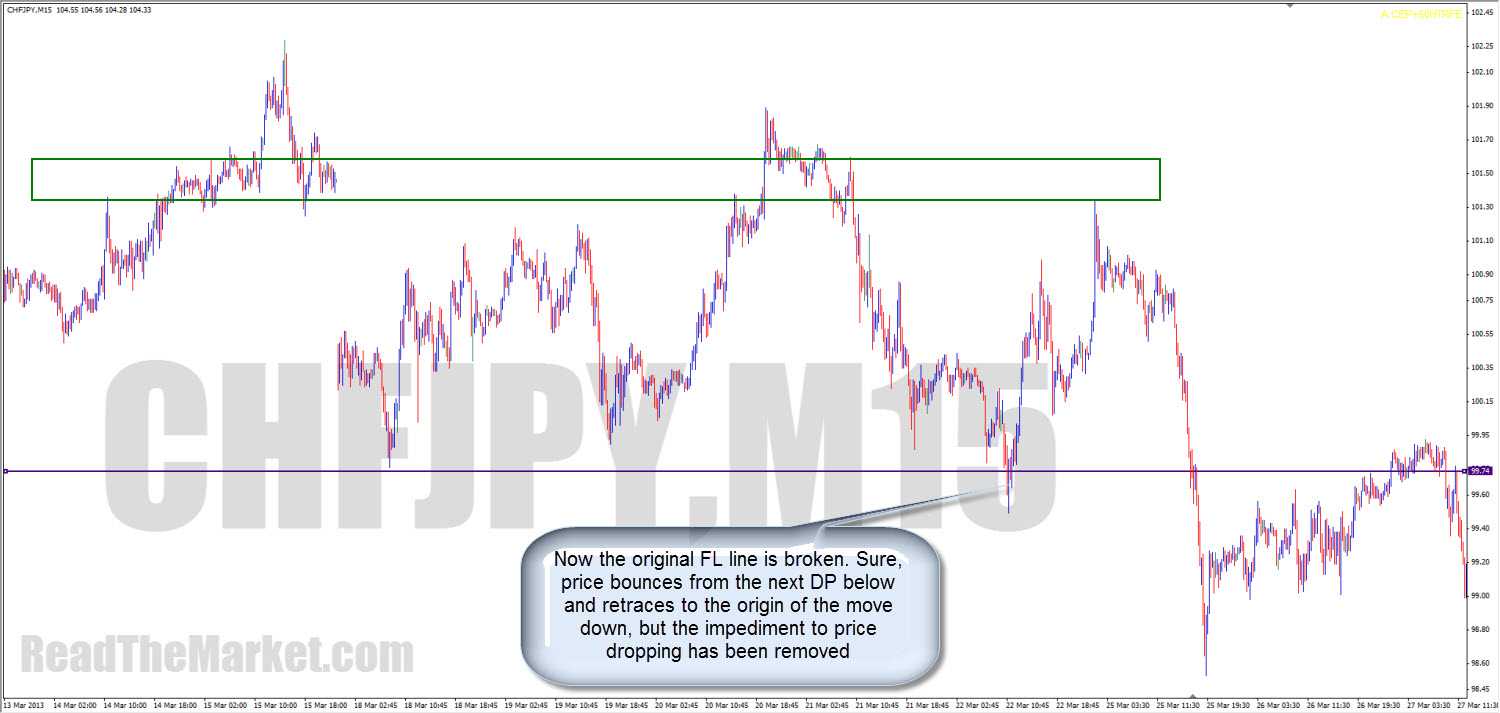
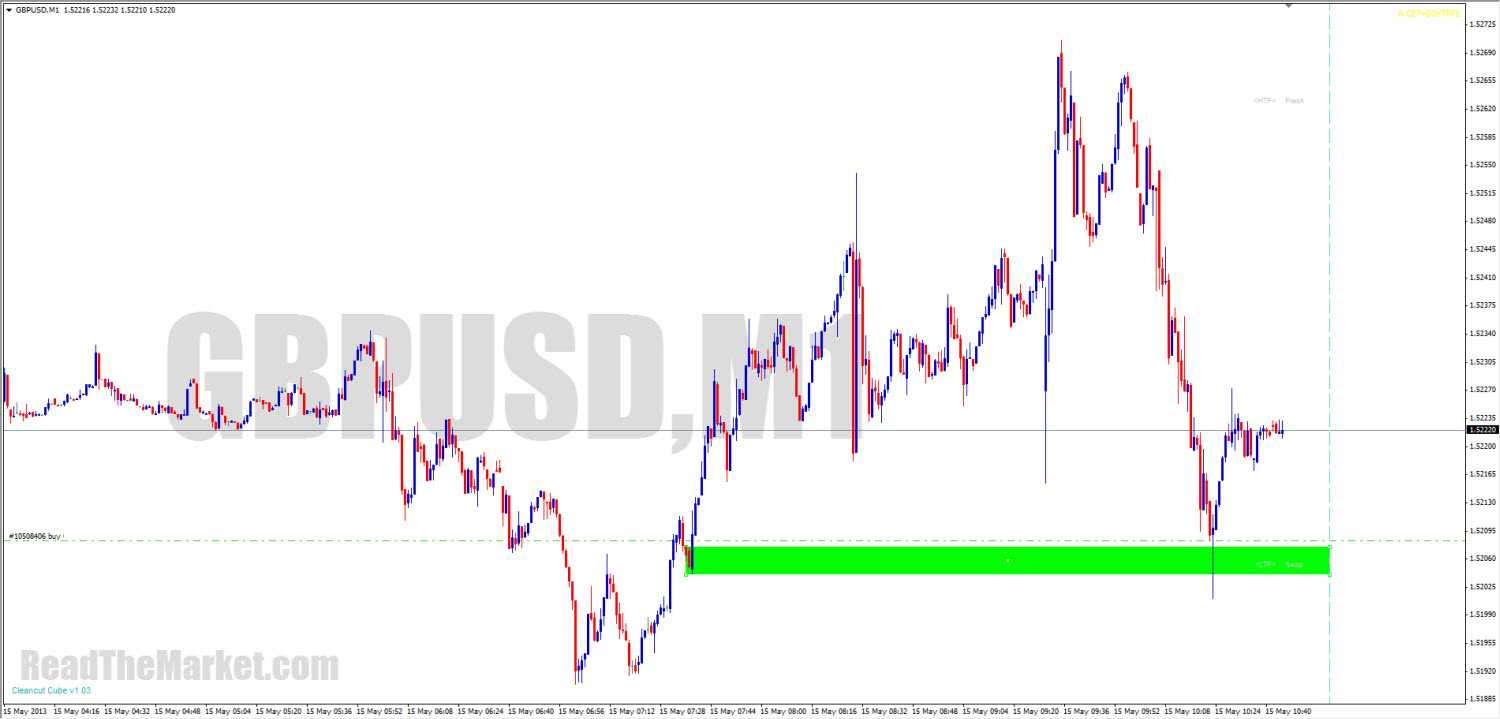
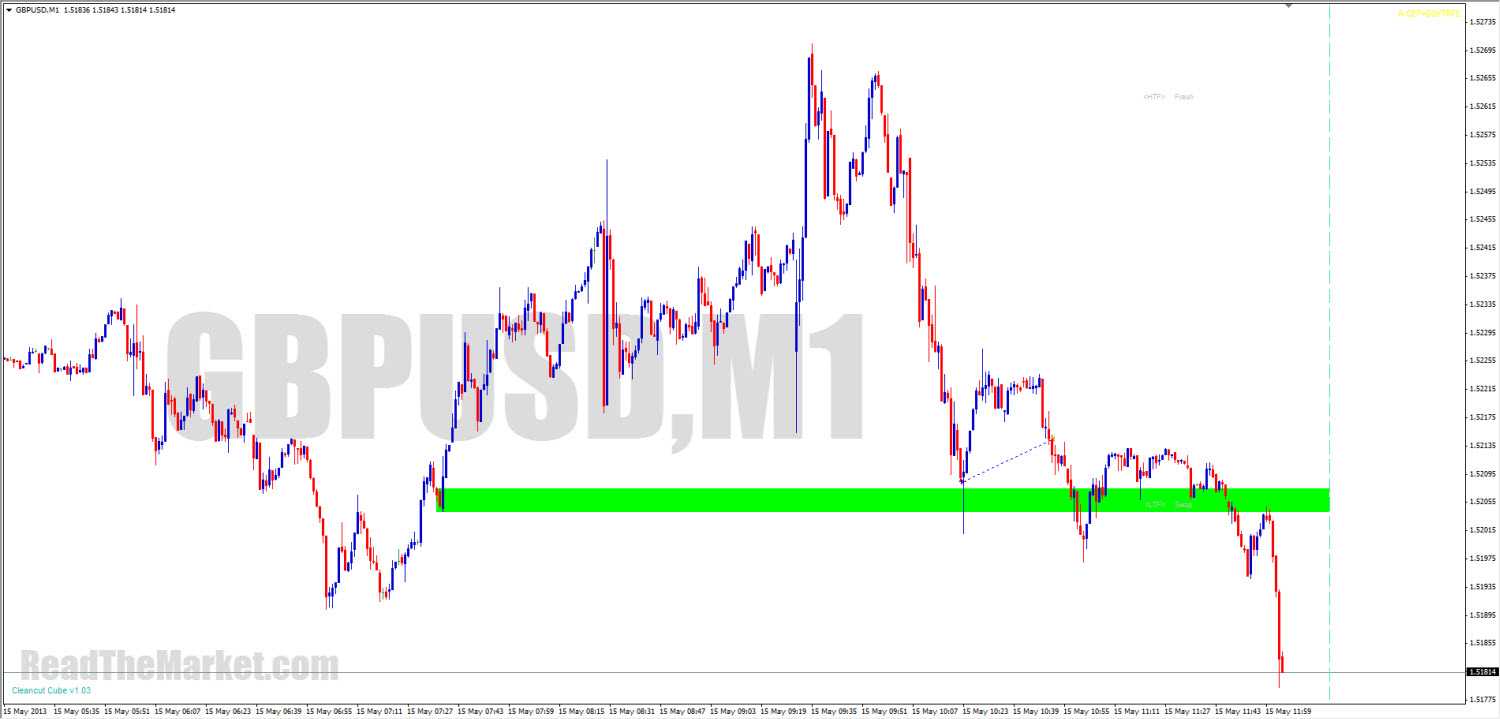
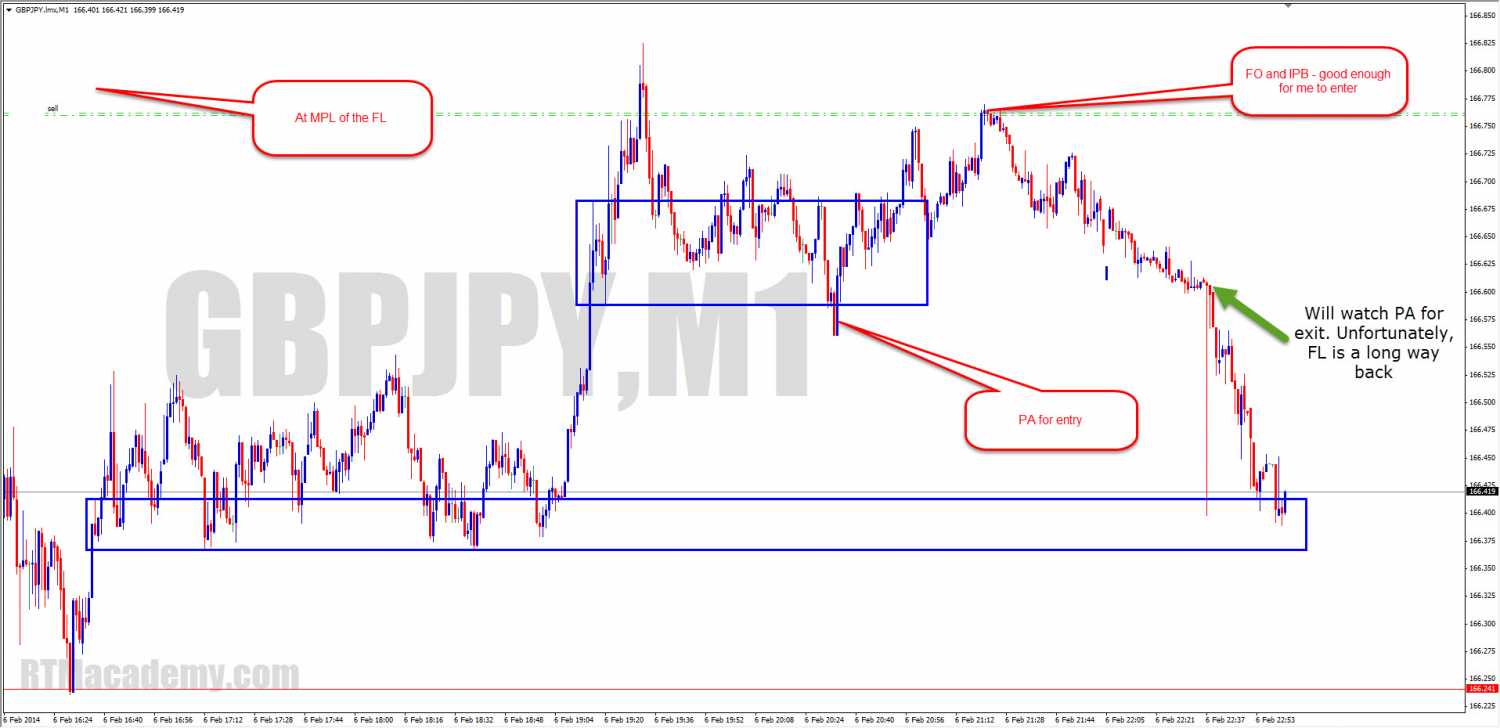
Identify and demonstrate an understanding of the FL and the
circumstances in which they form
Real Price Action 3
Objectives:
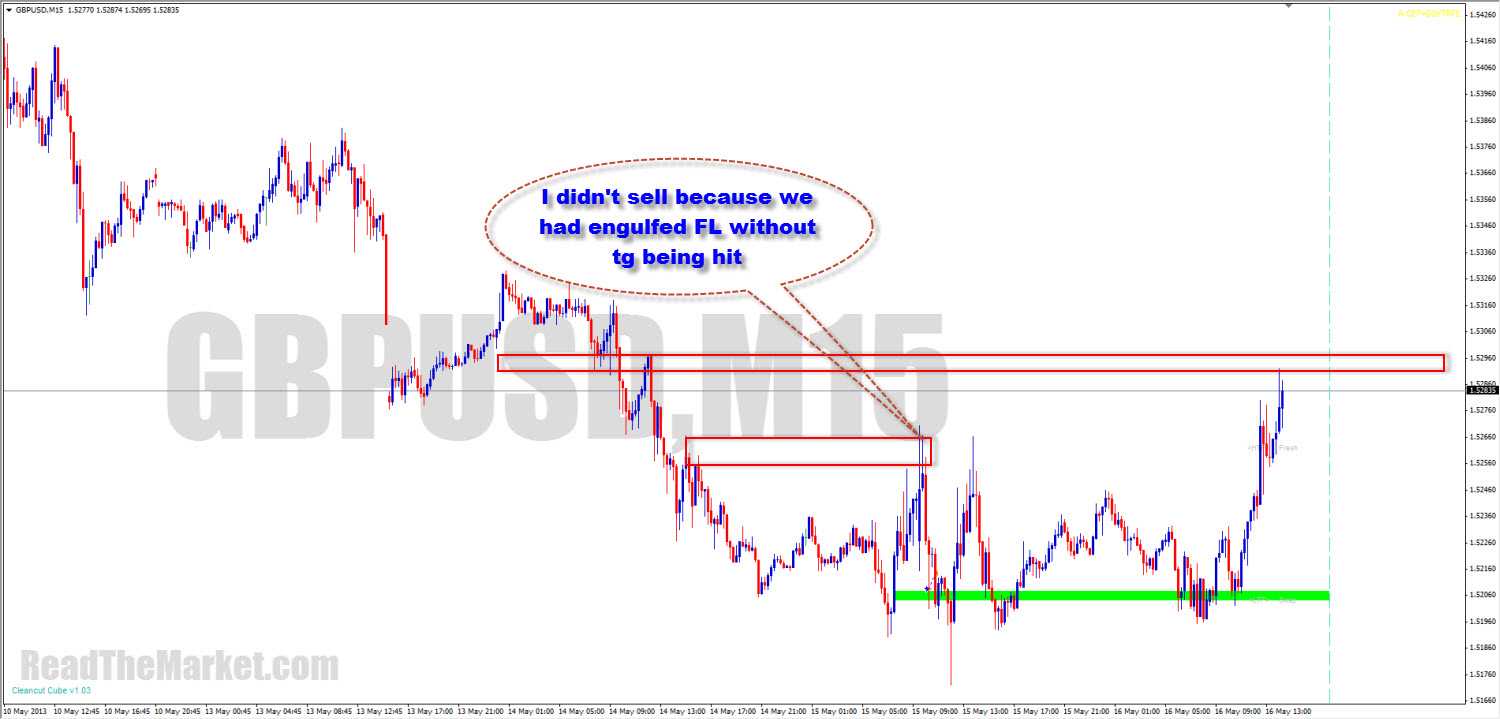
Critically evaluate the IF/Then rule and all its implication. Be able
to identify it in a live market
Demonstrate an understanding of how different sized FL interact and how
these interactions effect price movement
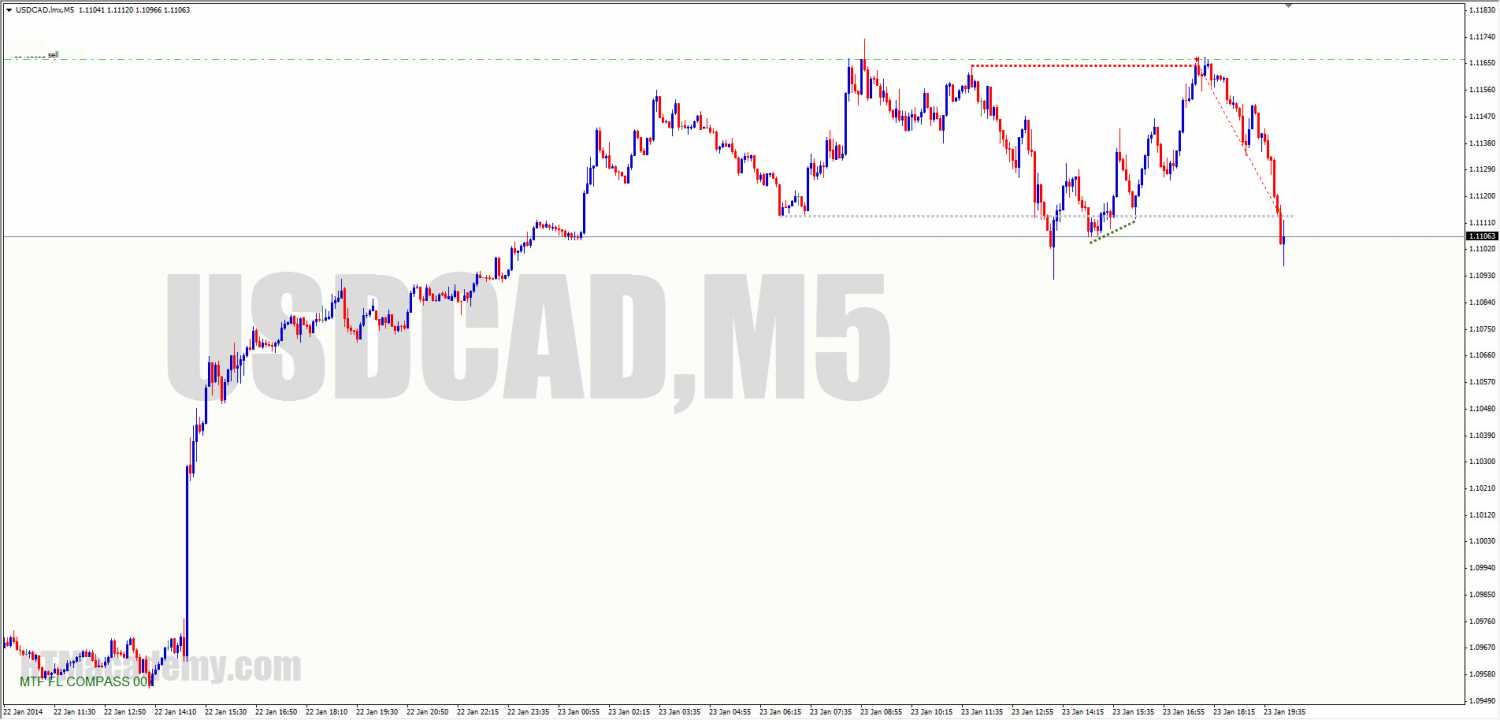
Learn to use the multi-TF FL Compass to stay on the right side of the
market at all times
Understand the max pain level in implied flags
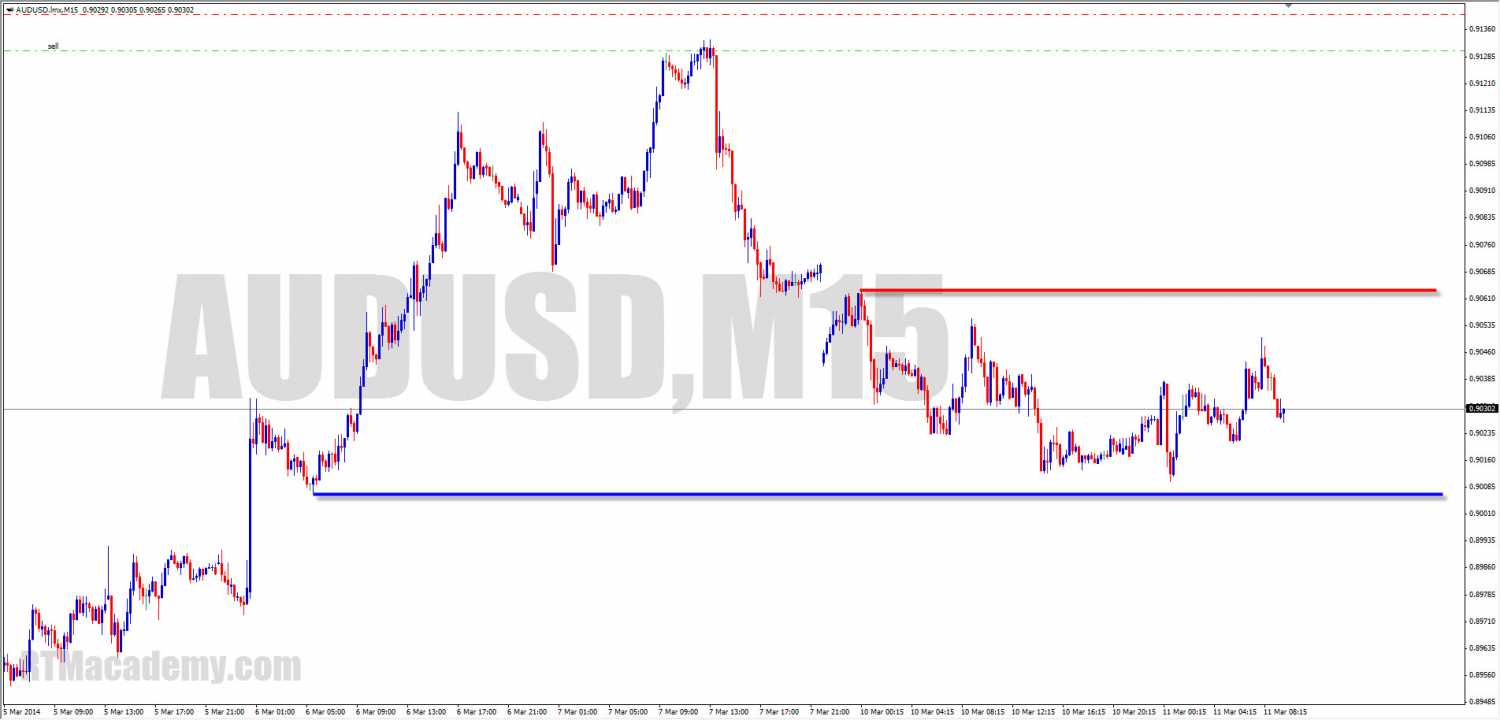
Investigate flag completion and evaluate how price can move in order to
complete a yet to be completed flag
Demonstrate the absolute essentials of Price Action
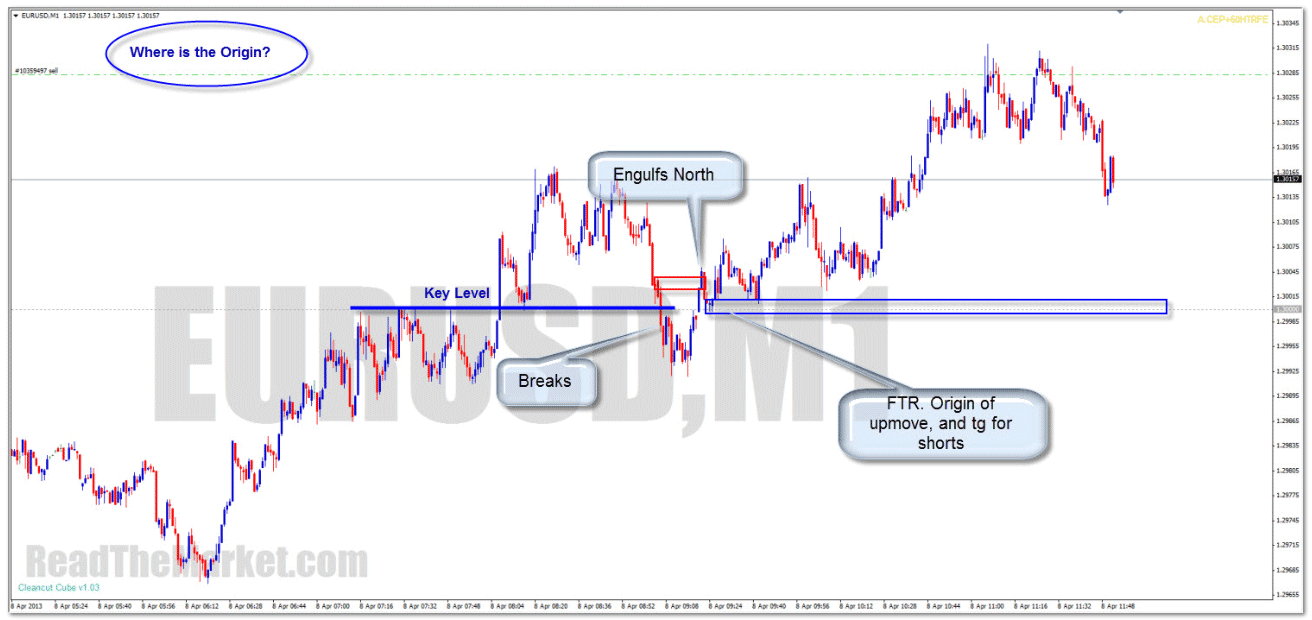
IF's QUOTES
If
the signal is given by the market mover (an engulf into a new zone), then price
is very unlikely to break the extreme of the zone it just came from. So, if you
have the patience to wait at the last remaining set of unfilled orders in the
origin, you can be almost certain that that price will be respected.
There
is absolute order in the market. Nothing at all there happens by chance. That's
why it's so easy to read what's going to happen next. There are rules which are
strictly followed; so much so you'd imagine it's all run by algorithms, up to
the moment when the signal is decided upon, and straight away thereafter. There
is zero chaos in the market. It's elegantly designed; a beauty to behold.
Fakeouts
are extremely easy to predict. Most SD traders still look directly left, which
is the big shortcoming of Supply/Demand trading. It's further left again we
should be looking.
Say
price is coming up to a supply. The only way we can be sure that supply will
hold price down is if that supply has already visited the extreme set of orders
in the flag limit to its left. If the supply fell short of that, we can
anticipate a FO to those extreme orders. Extremely simple stuff.
We
always look to what S or D are reactions to, rather than just S or D
themselves.
Look
for tricks being played on approach to a place where a trick was played, and
you'll find where price will turn.
If
you can look beyond S/D, you'll see that the Flag Limit is the only true place
to look for PA for a trade. Trade these levels and you're taking gambling out
of your method.
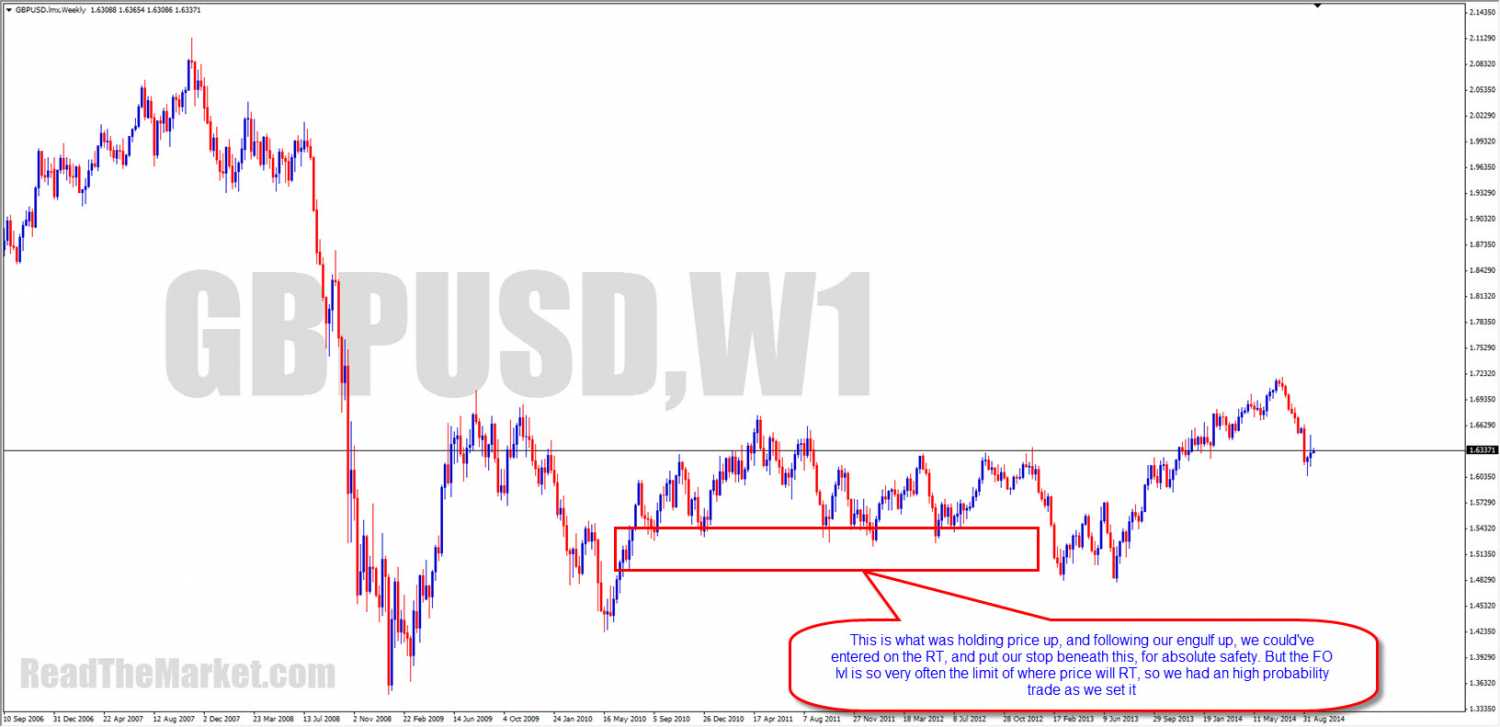
All
we can ever hope for is a bounce at these levels, unless we are certain that
this level is the deepest possible point of retrace after a previous engulf.
Without that, we must watch PA as it develops, both before and during the
trade. Set and Forget trades can only be taken once the signal is given and the
target is clear.
If
I see a zone has been tested already, I'd want some very good reasons for
trading it next time back
Price
action is all about reactions to decision points. The candles we get around
them depend only upon when price meets the levels.
We
must never make decisions based on candles alone - we trade decisions and price
action instead.
Yes,
it's about finding where decisions have been made in the past, but it's also about
reading PA before price hits, seeing how many pockets of D or S
have been consumed along the way, taking in all the signs that price may want
to turn, giving you the confidence to enter the trade, and an idea of where
price wants ultimately to go, and then reading the PA upon and after the touch
S
and D certainly is massively important, and most trades can be entered and
managed using just this alone. But just as much as SD predicts where
price will bounce, PA creates the conditions for new SD to form.
All
If's charts posted by Mel: http://www.forexfactory.com/showthread.php?p=5678103#post5678103
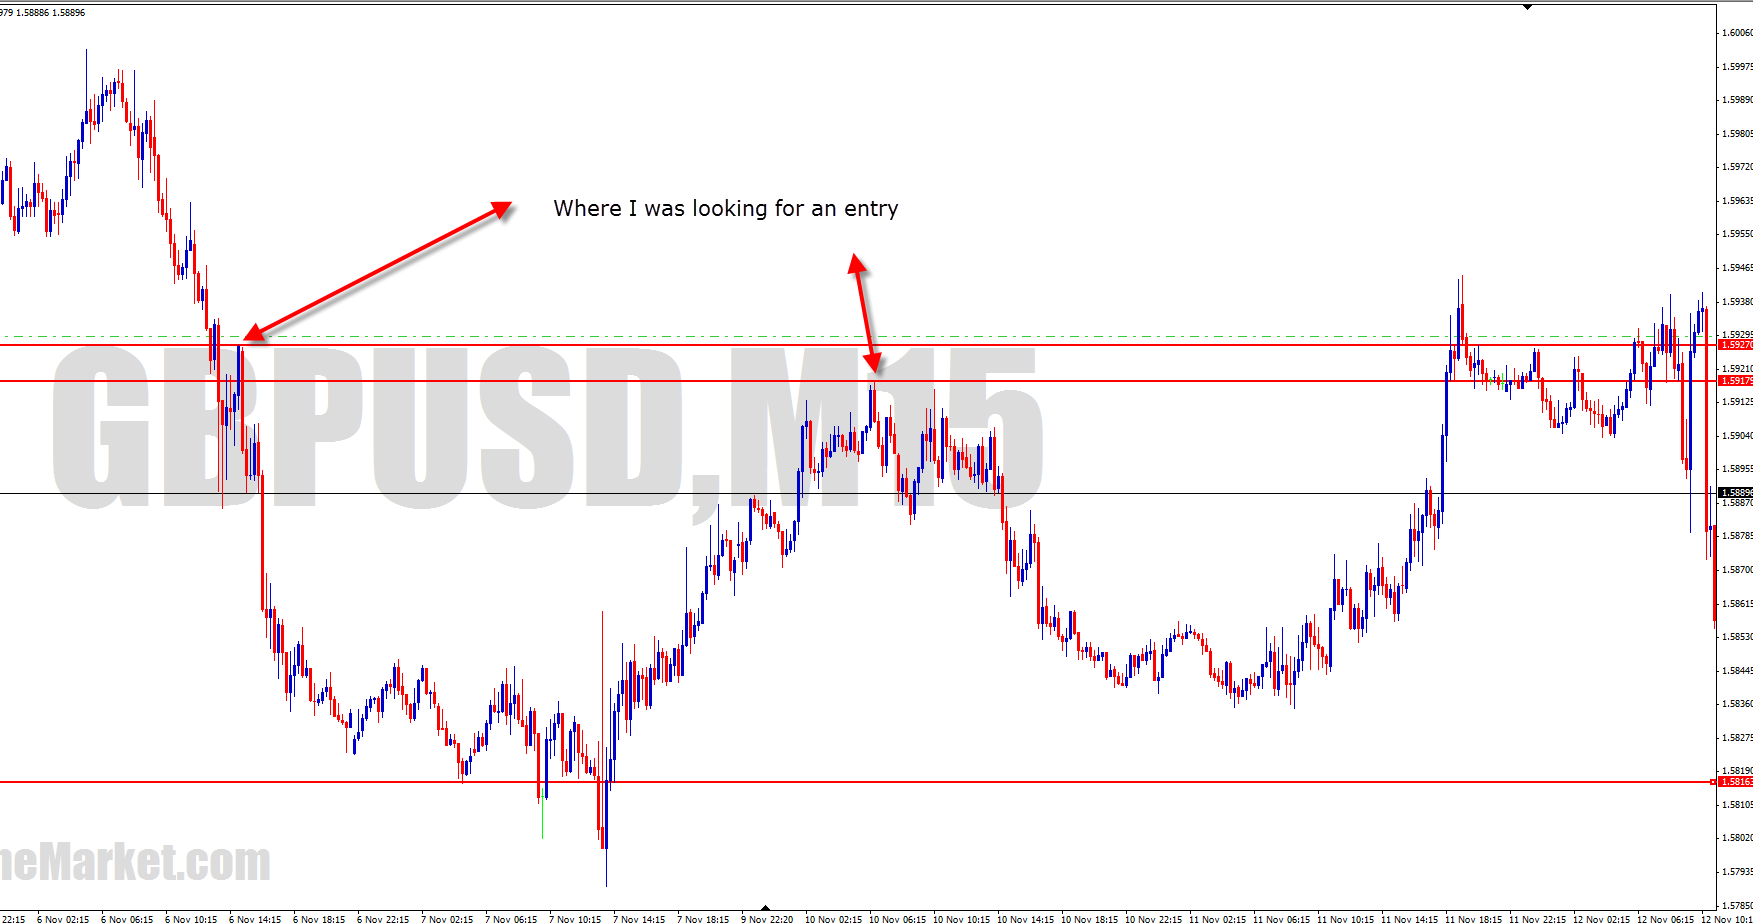
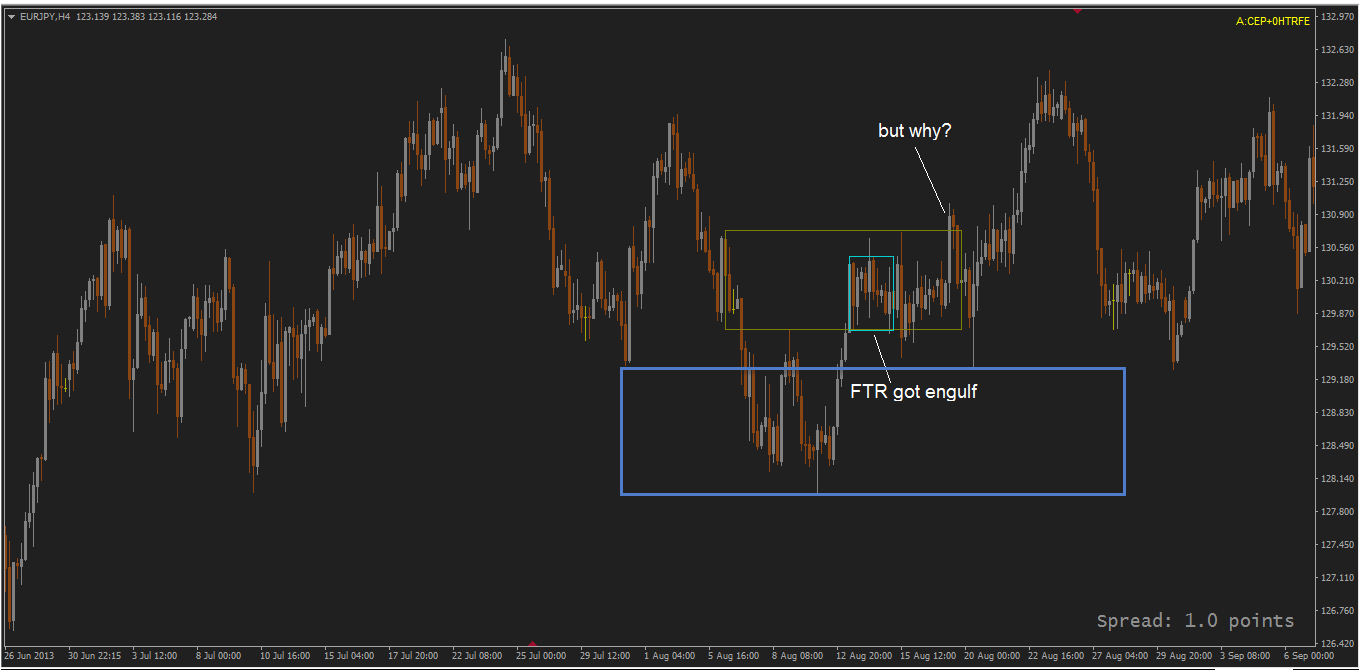
Where I do have a problem with
shorting at S, is if price made a rectangular flag just beneath it, as the tg
is now so much closer, and I wouldn't feel entirely sure about shorts until
that flag got engulfed
If
you know where price is sure to bounce, ie. a big decision point, it's totally
up to oneself whether one can bear to see price come back towards one's entry.
I suppose if you have great conviction in the bigger picture setup, or your
screen time is limited, you can set and forget.
Always
trade at the very last set of untaken orders and you'll avoid getting caught in
the middle. If you do trade in the middle, manage your expectations well.
If
studied properly, you will come to a point where everything gyrating around
FTR,
Price
engulfed important level and FTR becomes FL
FTR
overlaps each other become compression
FL
engulfed price retrace to FL becomes QM
Pole
and a drop and compression to FL become can can
3
drive - it another form of compression
but
simply we look for those areas that some decision made to break a barrier
(swing H/L) in a firm form that the FTB to that DP didn't happen yet. this what
a use in all my trades. we know what FTR is ,what FTB is ,what DP is ,but we
must know why price is here also it is more important .
Being
patient is absolutely vital for making giant trades. We must wait for the very
best possible places before we enter; the places where you'd expect great PA to
react.
If
you're around to watch the PA unfold, it's rare your stop should get hit. Price
will so very often retrace enough for you to get out without a loss. That's why
I wait for the very best price to TT - it tends to keep me in the black.
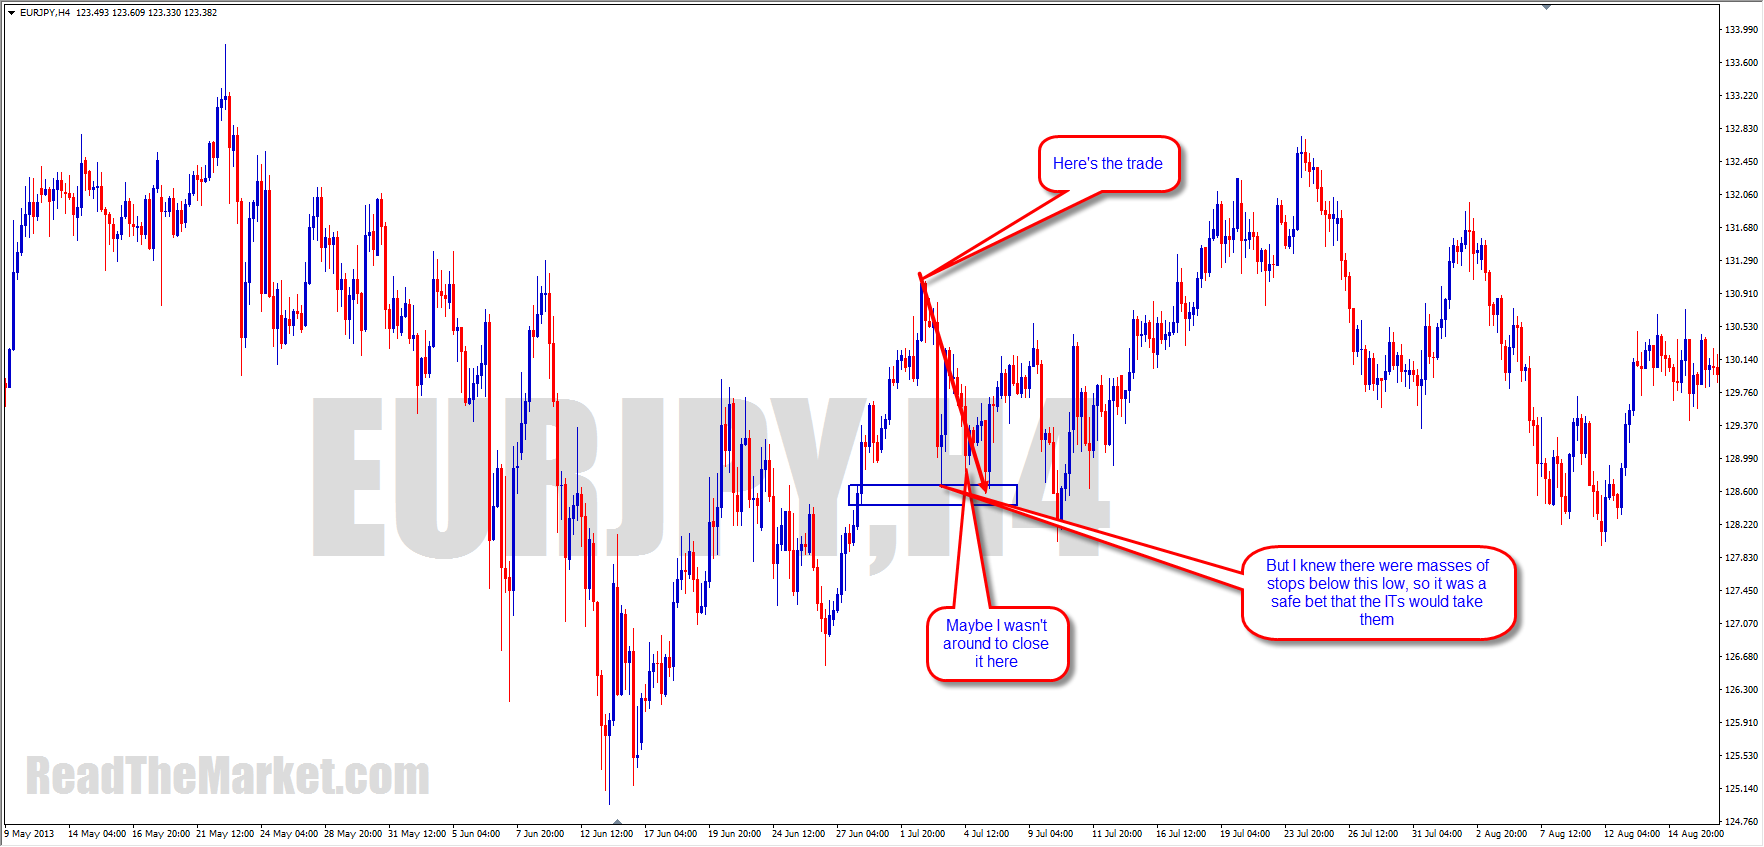
I'm
not even a part time trader now, so I miss nearly every piece of action there
is. If I ever open the charts and see a trade opp right in front of me, I take
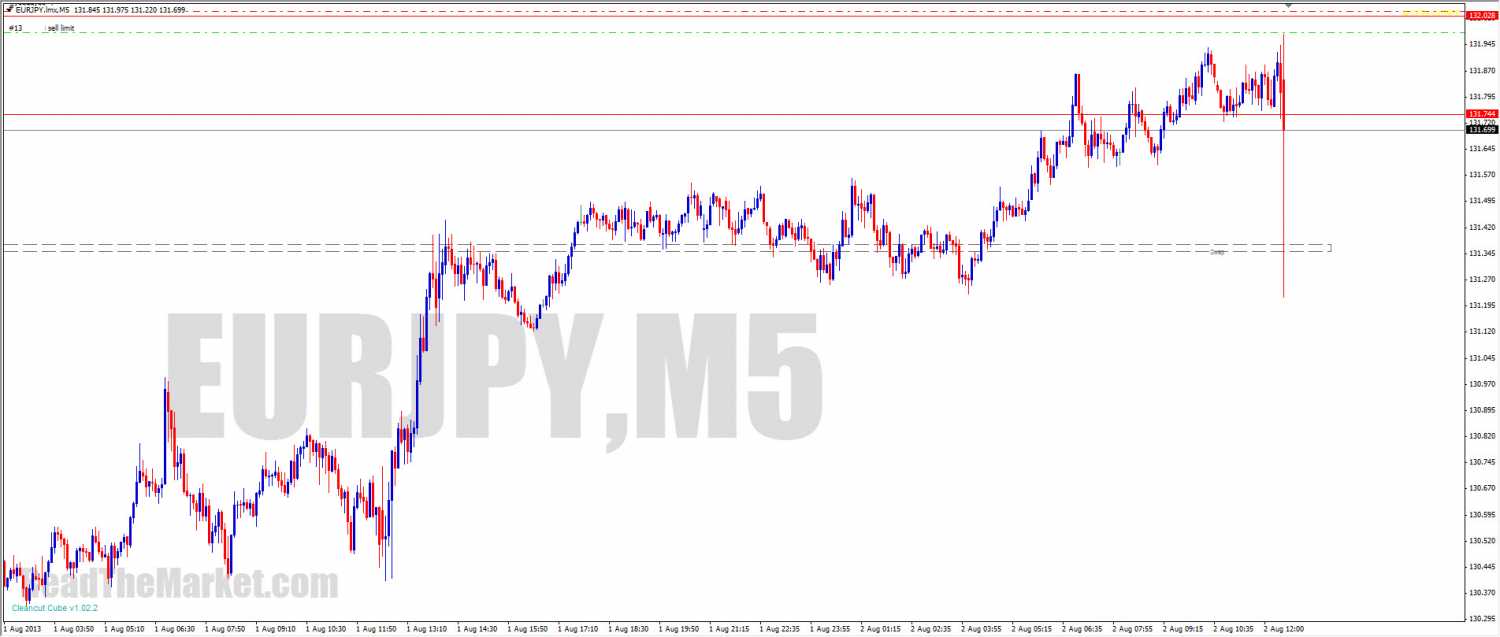
it. However, I usually get between 10R and 25R per trade. If I lose, it's
usually no more than the spread and commission. There are between 5 and 20 such
confirmed trades available every day.
First
of all, we need to understand that time has no place in any read of the market.
The only way to be completely sure of where a FL is, is to be there when the
break occurs, and mark the highs and lows as they occur. Within a minute they
can be obscured by a candle, but we'll know exactly where they are. If we're
not there to watch and mark, we must use the full candle as a FL.
If
we've had an engulf and are getting in on a RT, we must always be ready for a
diamond to occur, especially if price hasn't yet hit MPL of the zone the
original bounce was a reaction to. So, if we're not going to be around to watch
PA, our stop must be beyond the original FL.
Funny
you should say that, as I teach to always and only trade within a flag.
Sometimes the flag will already have developed, and sometimes the flag is to be
made while you're in the trade. Either way, always trade within a flag.
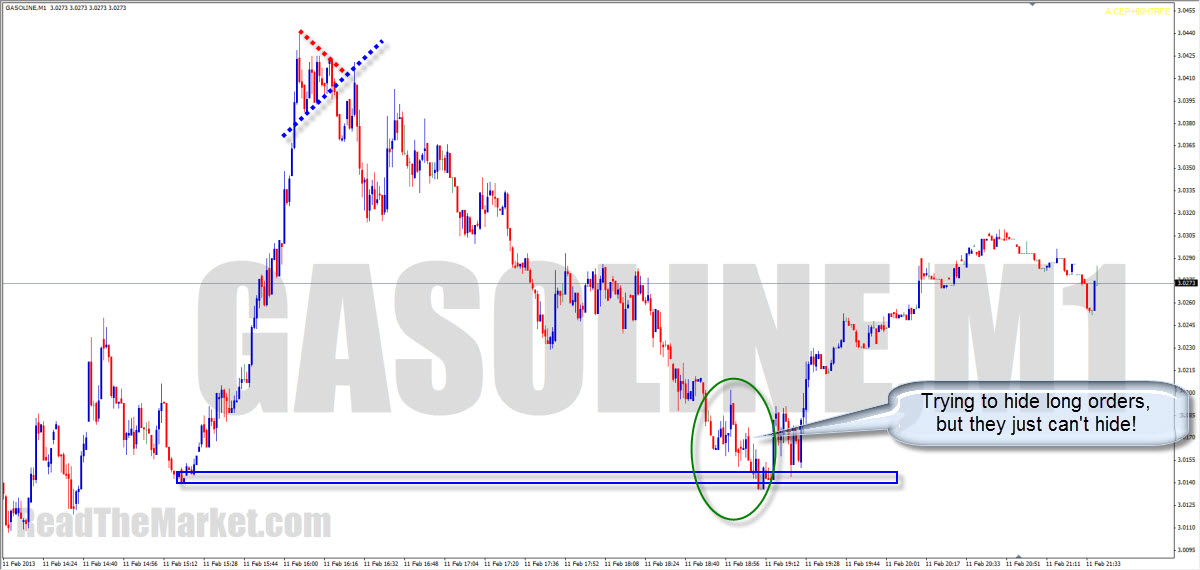
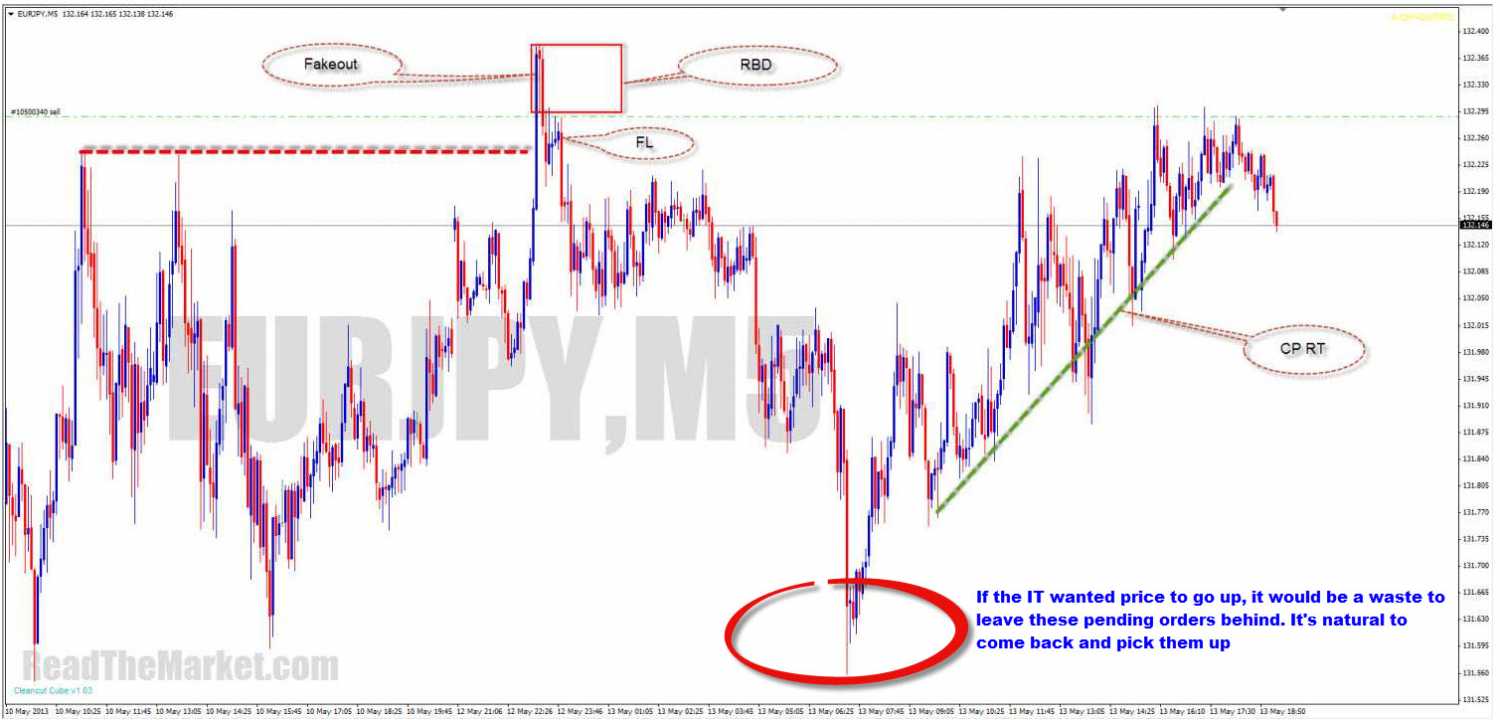
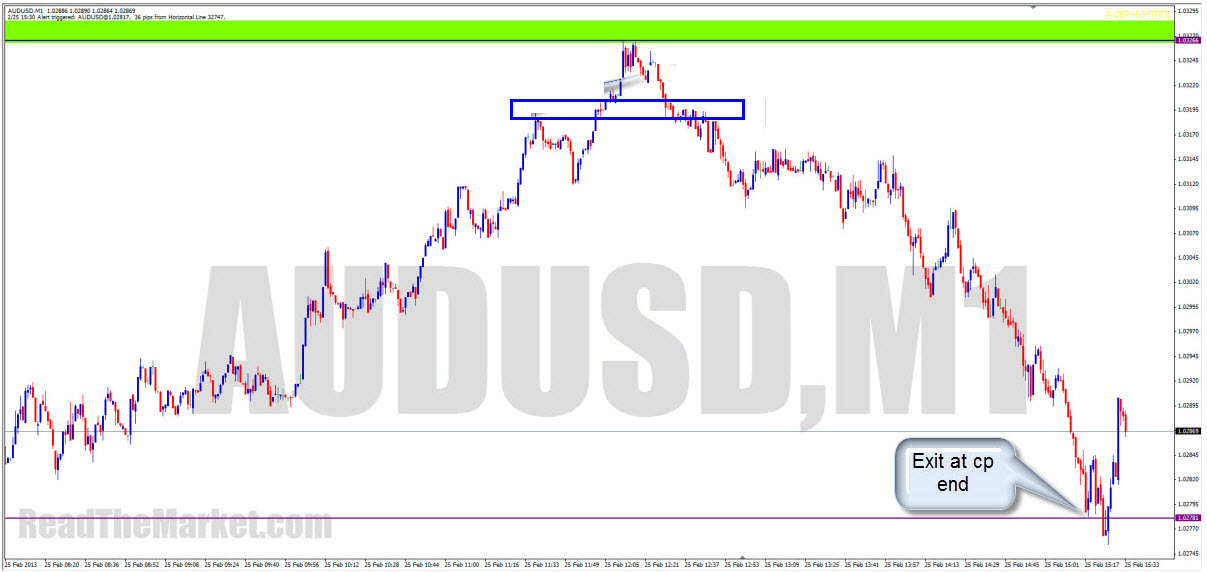
Attune
yourself to what the buggers are doing, and don't let them fool you. Just know
they've got orders to fill at a level, watch them fill some on approach (CP),
see the momentum, and watch them come back to fill more orders 'til they've had
their fill.
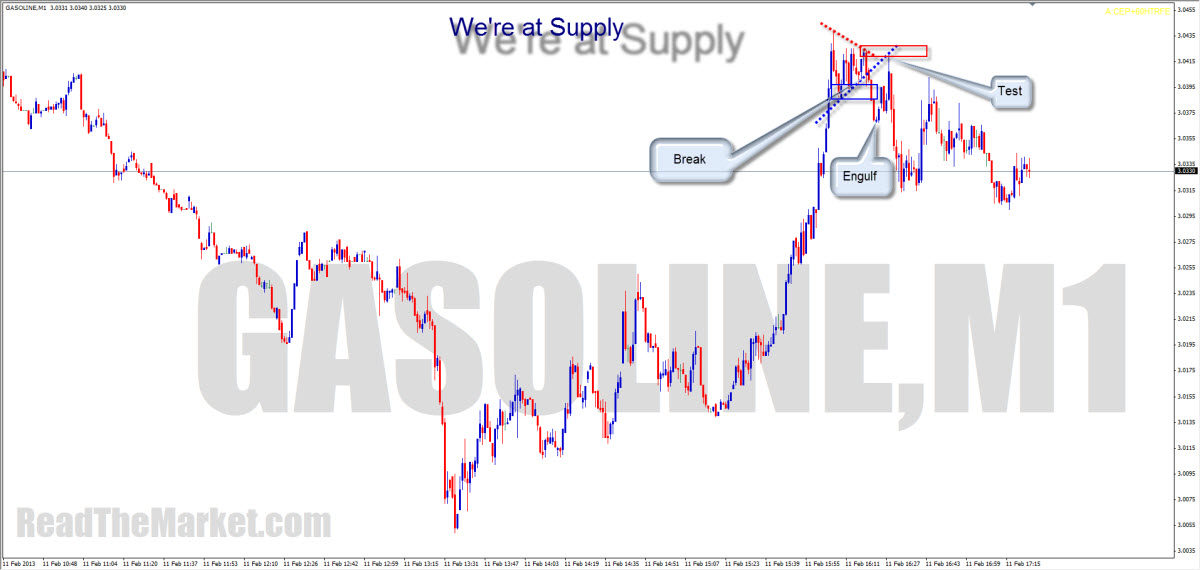
This
perhaps should be the first thing that anybody ever reads regarding trading:
We're always looking for signs of what the big guys are doing at significant
areas, and if we don't see what they're doing, there's no trade. So, on
approach, if we see the big guys trying to hide their orders in the market, we
see compression, and can feel pretty sure of their intentions - to get in as
many orders as they can before the turn If we don't see this, we can be pretty
sure that it won't just turn immediately, as there usually won't be enough
orders against them to fill all the orders they must fill. This
is why we wait for an engulf. This shows their intention to reverse price. Then
we watch them trying to hide their orders in the market on a retrace, ready to
take price to the origin of the move.
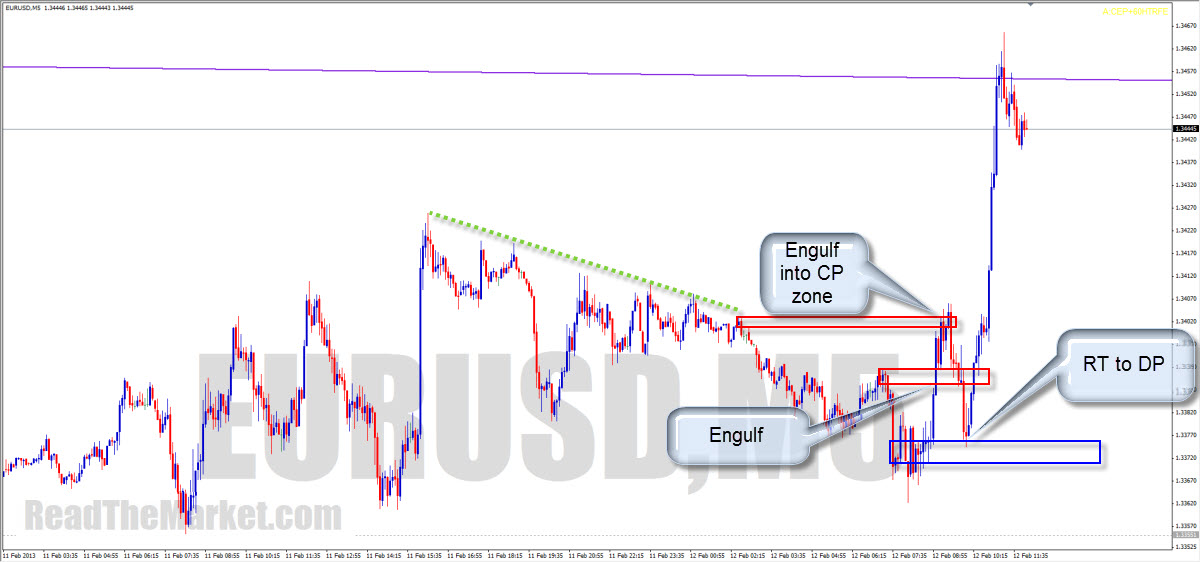
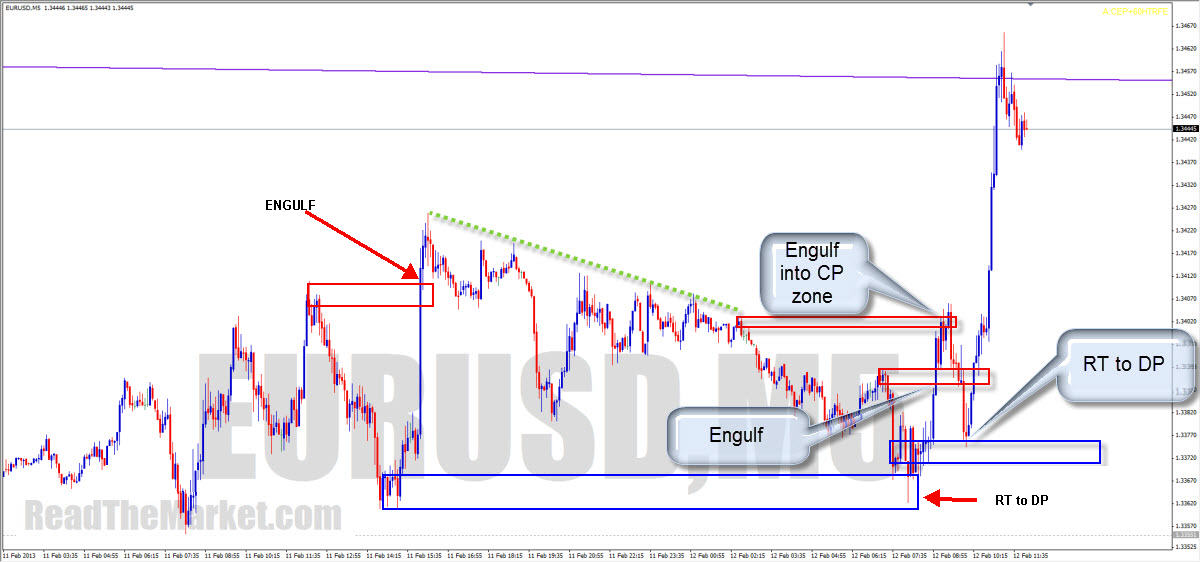
When
we see decent CP coming into the base of a pole, we are very often safe to
touch trade the base. The safest thing to do however is to await the first
engulf into the cp zone as confirmation.
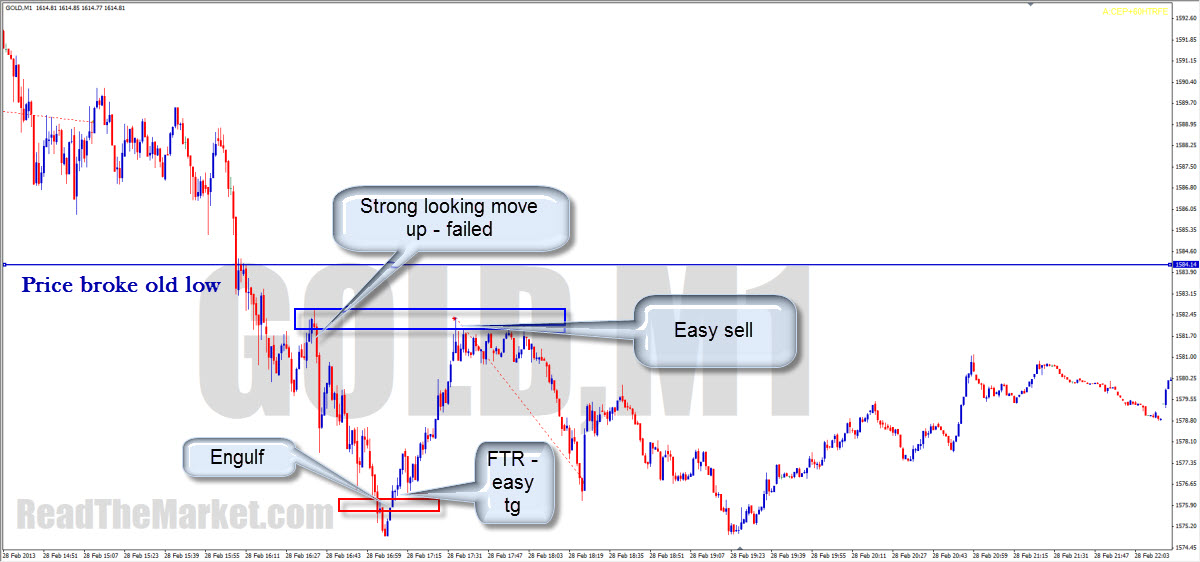
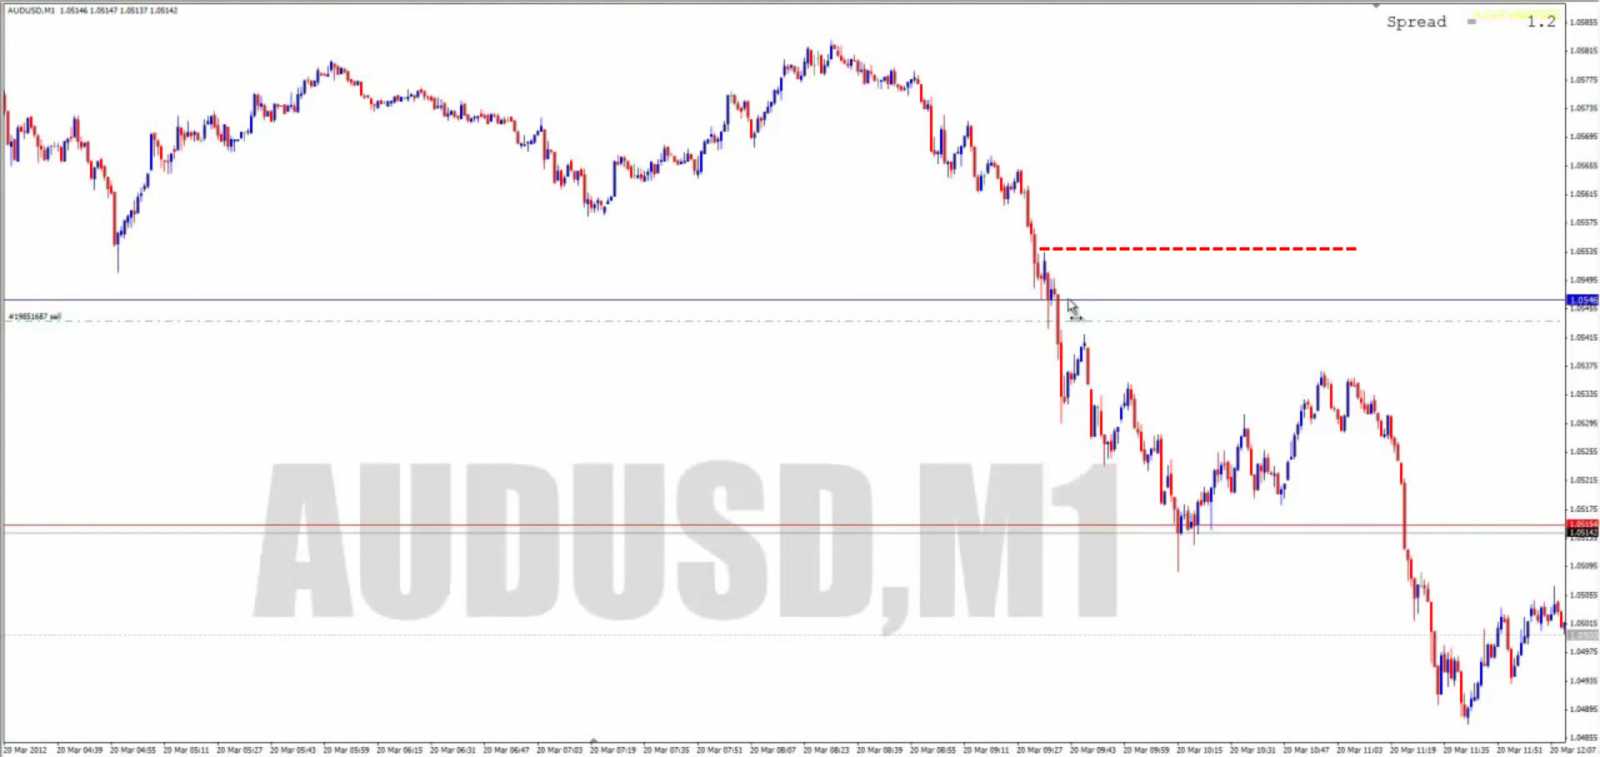
Very
often a zone will break strongly and price will retrace but fail to retouch it.
This is still the FTR - the confirmation of a new trend (do a study of how
price reacts and how far it goes after hitting this spot). So an FTR can be
first time back, but doesn't need to be.
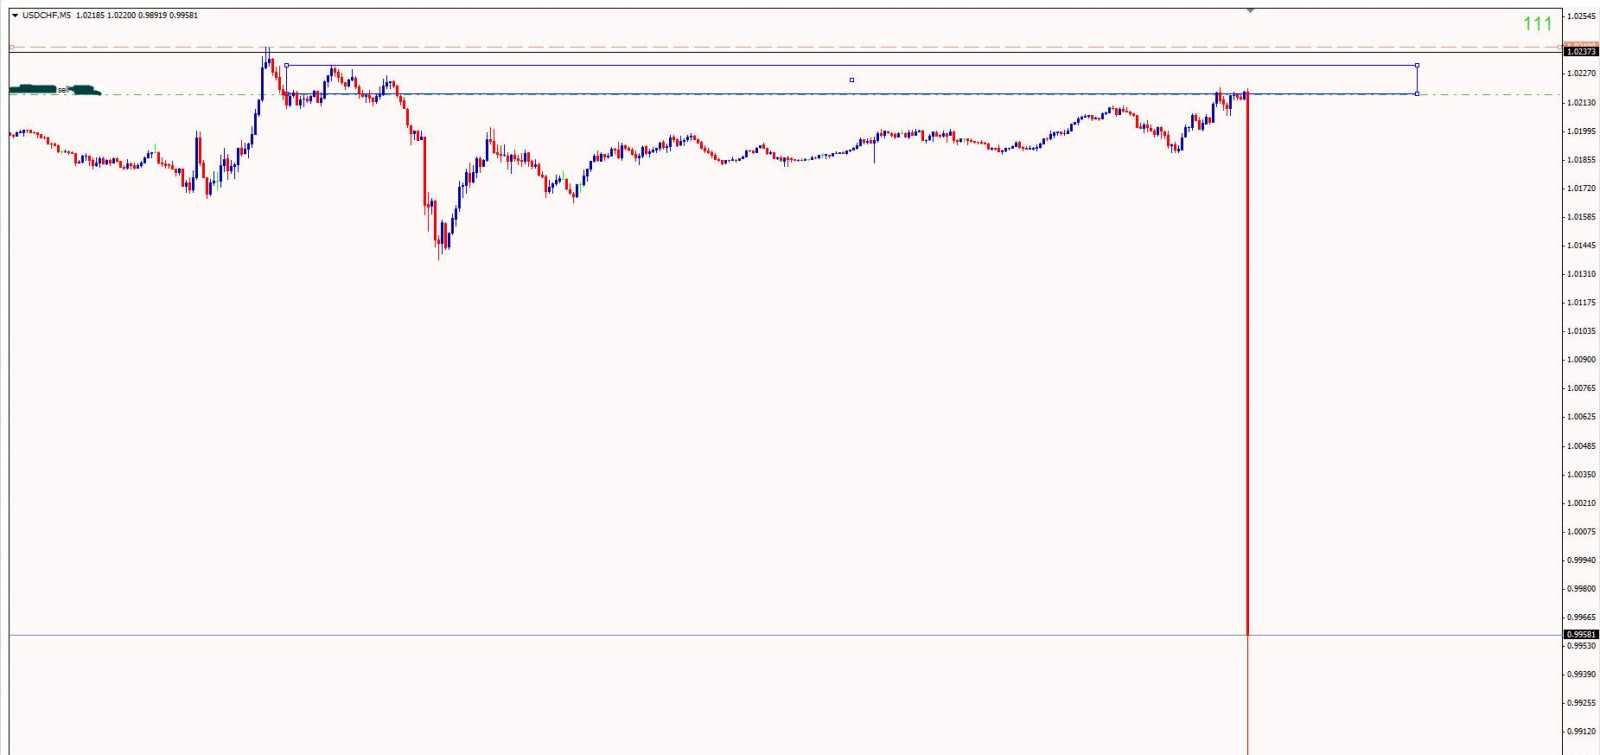
During
holidays, volume in the market is often greatly diminished. This would lead
some to imagine that price hardly moves. But. Say someone decided to put a
truckload of orders into the market. If there's nobody else in the market to
oppose these orders, price can do nothing but shoot away. So remember. Low
Volume can = High Volatility.
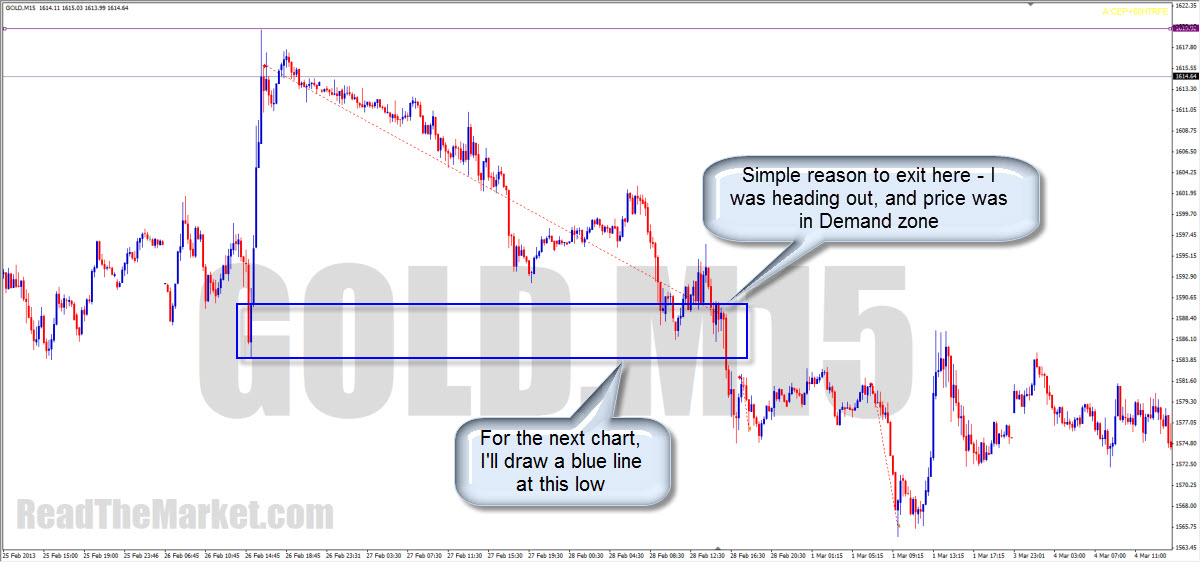
Until
now I have been so unfocused on the charts that my exits have been very sloppy.
My trade plan now has a couple of variables, but essentially I'll let price
travel back to the other edge of the last PAZ in the TF I'm trading. If it
engulfs, I'll exit on a RT or a break of the next LTF FL. If it rejects, I'll
let the trade run and await exit PA.
It's
all about getting into the mind of the market makers and trading as they do.
Nothing special.
Most
of my analysis comes in after the trade is entered. Before taking the trade, I
do as you said - simple - it's really easy to find pockets of orders which will
bounce price, and if they happen to be at great htf levels, even better -
there's the highest chance of them giving maximum pips. What I do certainly
looks like touch trading - picking tops and bottoms, but what you said belies
that. These are not tops and bottoms, but retraces to the best price to re
enter. Once I'm in though, I'm never guaranteed massive returns - sure price
will bounce where I enter, but I'm never complacent until I've seen the engulf.
In fact, I'm never really complacent at all. If PA tells me to get out, I must
get out!
Many
might misconstrue us as pattern recognition traders - we're not. Certainly
while learning we look for recurring patterns in the market. But once we
understand them, what becomes most important is WHY the ITs made them. It's
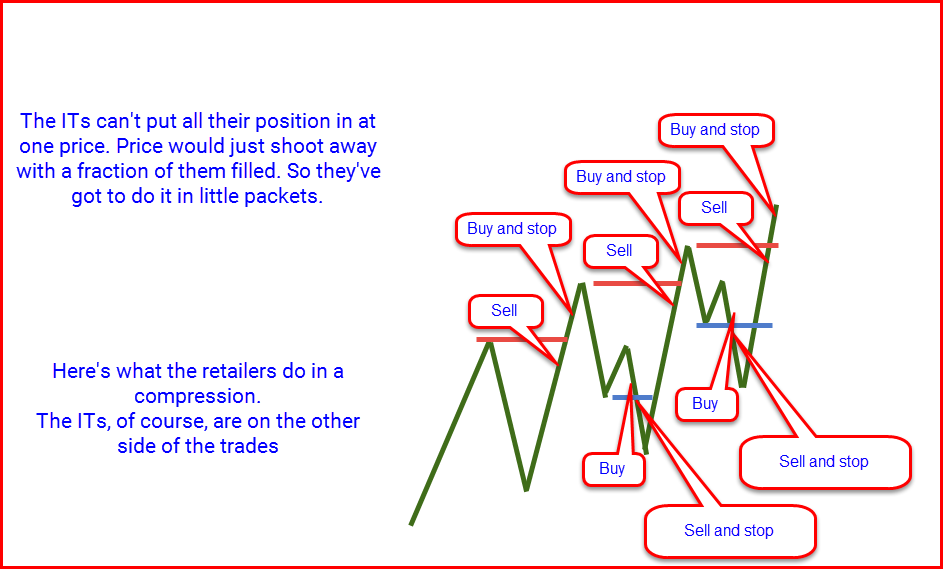
paramount to understand that it's not enough for the ITs to simply move price.
They must also get massive amounts of orders filled in order to make maximum
gains. They must also refrain from giving other ITs false signals, which could
ultimately cause chaos for everybody. Think of these things as you study, and
you'll be able to get into the mind of the market mover.
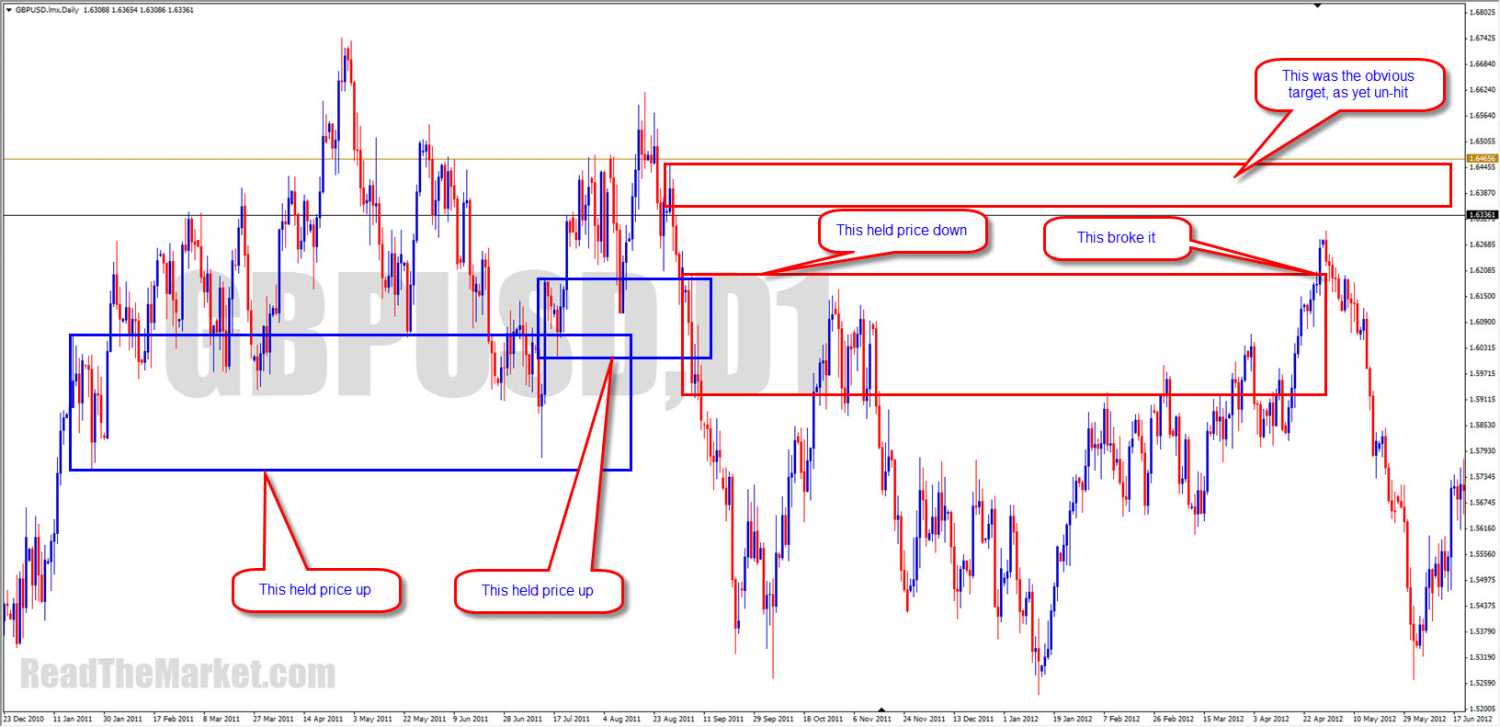
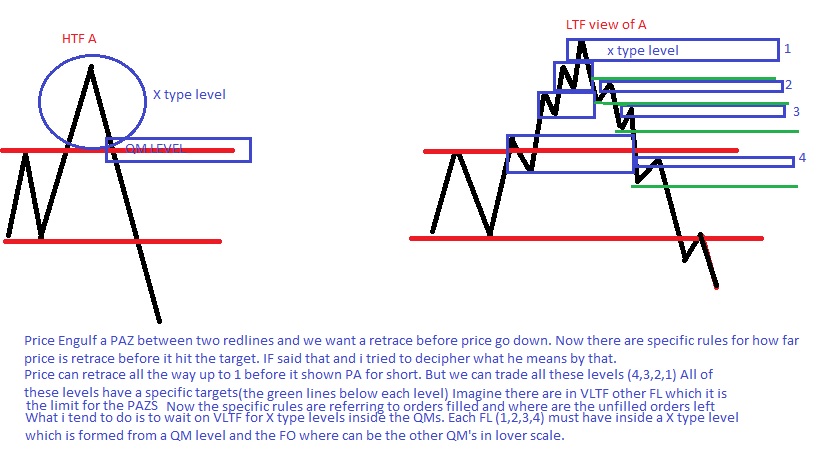
Here
are just a few targets for price, and the QM level is a big one. Certainly we
need to get PA for entry before or once it's hit.
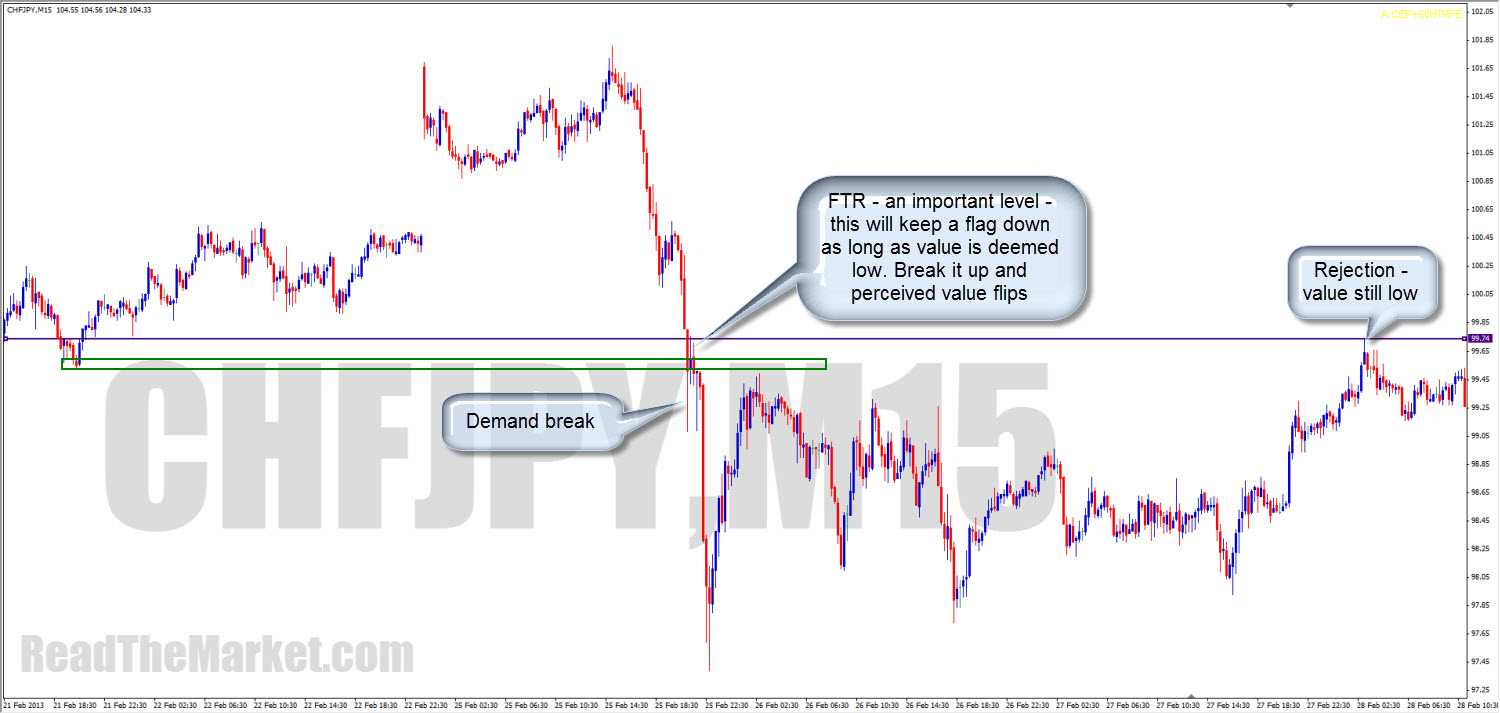
If
it breaks, then the same level can have the opposite effect on return.
Once price engulfs a level, all
that's important is how far it retraces before hitting its target. While the pockets of
orders remain in this RT, it remains strong. If price totally compresses
(picking up all orders) forward from the tip of the RT, then we will look
primarily for the orders at the entrance to said CP.
To
the ITs, candle closes don't mean a damned thing, so please don't use them in
your own analysis.
A
line is not the answer. Certainly, you may draw a line, but you must then go
into the LTF to find a DBR/RBD on the right side of the LL/HH swing which
covers that line. That RBD/DBR will be your box. You can scalp from each of
these, knowing that it may only be a scalp. If you're simply
setting a PO, then you must set your stop beyond the FL the HH/LL is a reaction
to.
The
usable engulf is the one which hasn't hit its target. Every engulf has a very
specific target.
Apply
that statement to your charts and eventually you'll see what I mean.
Being
only a sporadic trader (I really couldn't sit and watch the charts all day anymore!),
I tend to open the charts from time to time and ask myself what's coming up in
the next few minutes for me to take. If I'm lucky, I'll open the charts when
we're at an HTF level. If not, I'll gladly take whatever high R M1 or whatever
is there for the picking. 30 pips with a 3 pip stop is exactly the same as 150
pips with a 15. If there's nothing decent to take, I shut the charts.
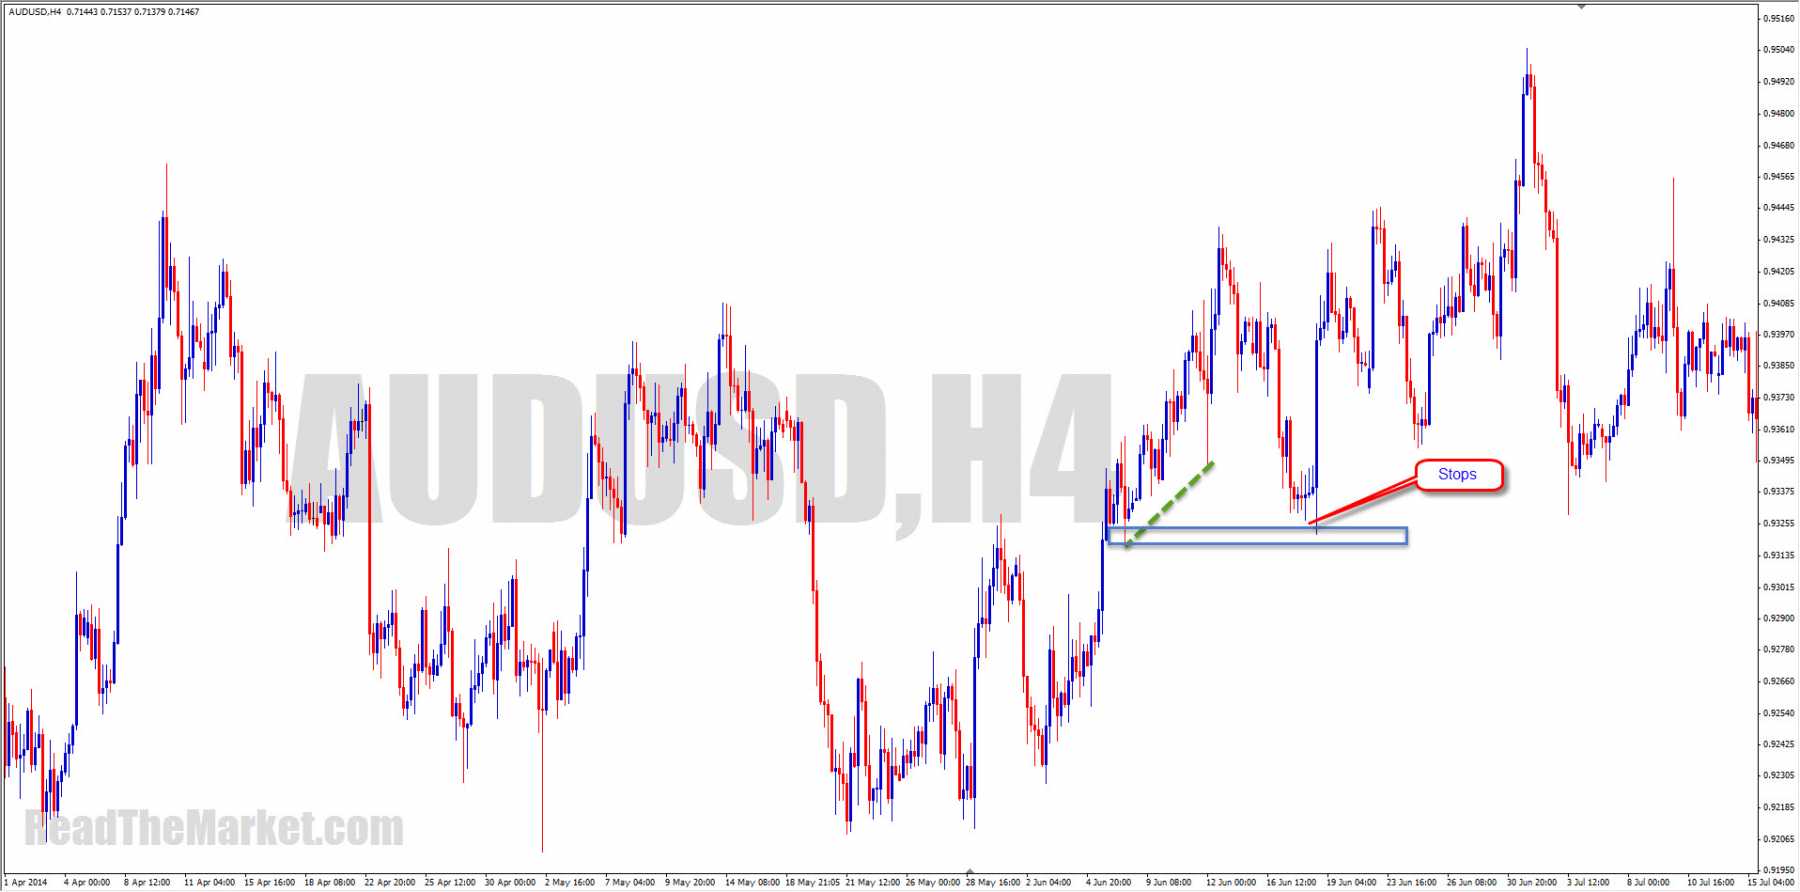
If
I were asked where to trade, in one word, I'd say: Stops
I'm
way too disorganised to use limit orders! I just open the charts from time to
time, and if I see the ITs scaring the retailers into closing good trades at a
good level, I enter. I'll take off some of the position at the first target, so
if my stop gets taken I can profit overall, then watch PA level by level. If
price doesn't get into a big zone quickly, I'll usually get bored and go flat,
having made enough to cover my next week's expenses. If I were truly
meticulous, I'd treat my exits the same as my entries, and trade up and down
all day, but trading is usually way down on my to-do list.
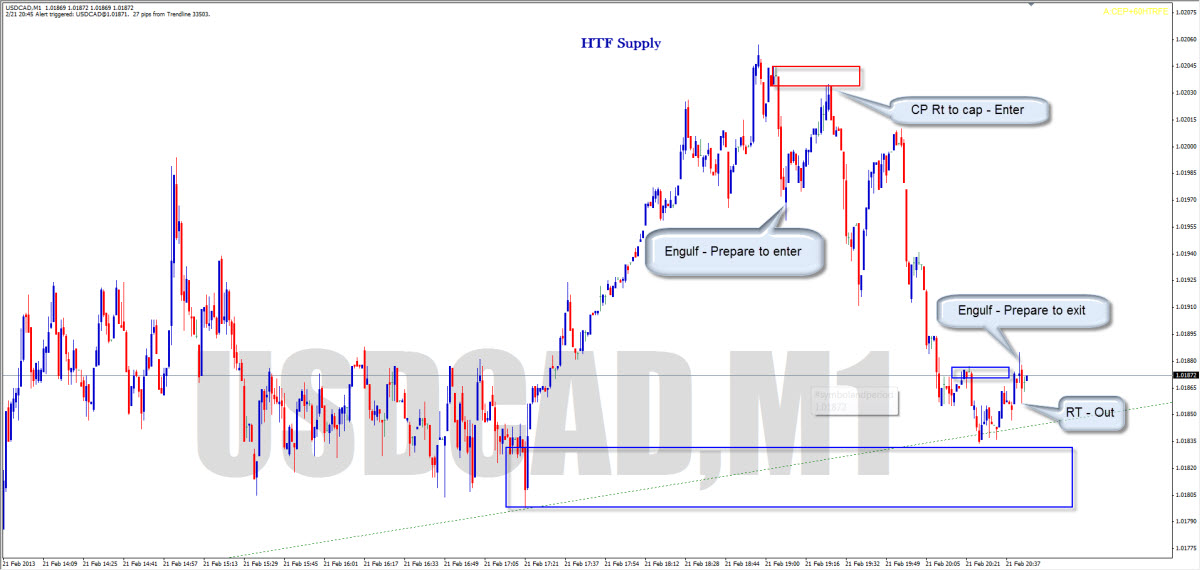
Certainly
there's an awful lot to learn here. But if I were to summarise what I think
is most important, I'd say look to an engulf into free space that hasn't yet
hit the origin (tg). Very often it will retrace deeply before advancing to the
origin. Learn to spot these, and you'll be better equipped than most other
traders out there.
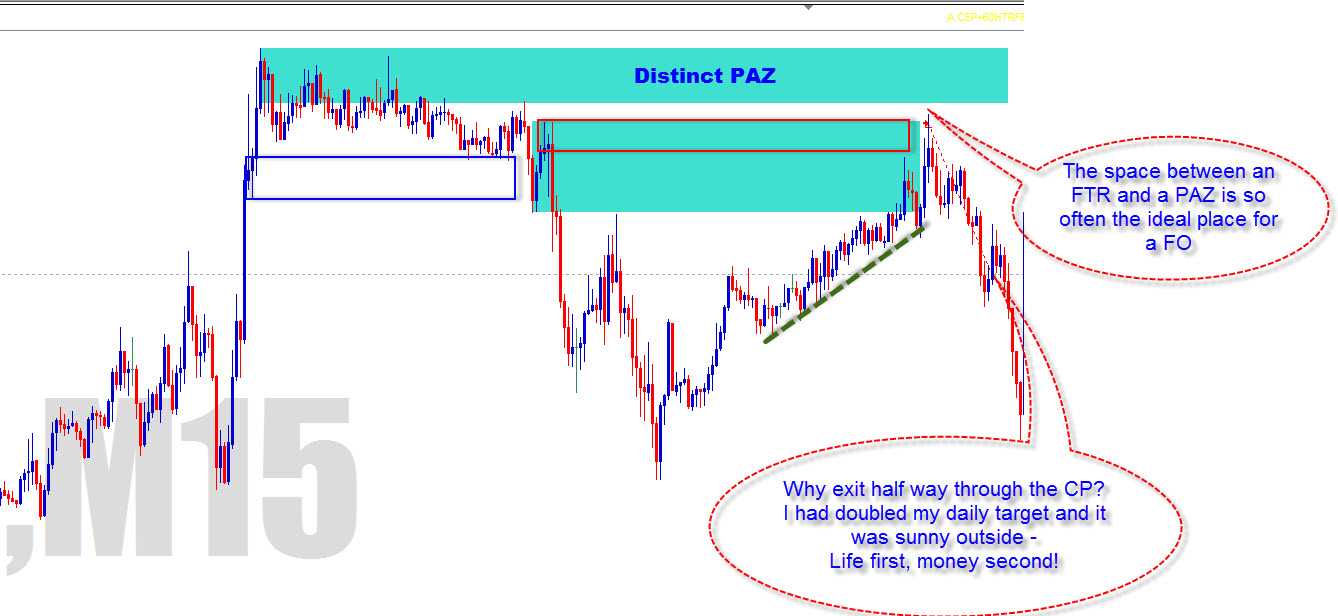
Price
moves from PAZ to PAZ. The clear target for any trade after an engulf is the
other end of the PAZ in that TF. If you zoom out to HTFs, you may find the TG
is even further, but if not, stick to the TF you're in.
I
just want to warn you though that watching candles is an absolute waste of
time. It distracts you from reading the story of price. The chart is a page,
and a candle is a word. A word in itself has little meaning; it can be taken
out of context. Sure, a sentence can be very powerful, as can a group of
candles. But to get a real sense of the story, we need to view it all as a
whole - be aware of how this paragraph relates to one many chapters back, and
get a sense of where the story will lead in the future.
In
essence, we know that if price engulfs South, it wants to move down to the last
engulf North.
We
want to read the story of price, and believe me, price has a story! You'll need
to go further left to get your analysis right. Yes, you've marked
levels well, but what are those levels a reaction to? Without knowing
this, you're just gambling. So, look left, read the story, and be better
equipped to predict what'll come next.
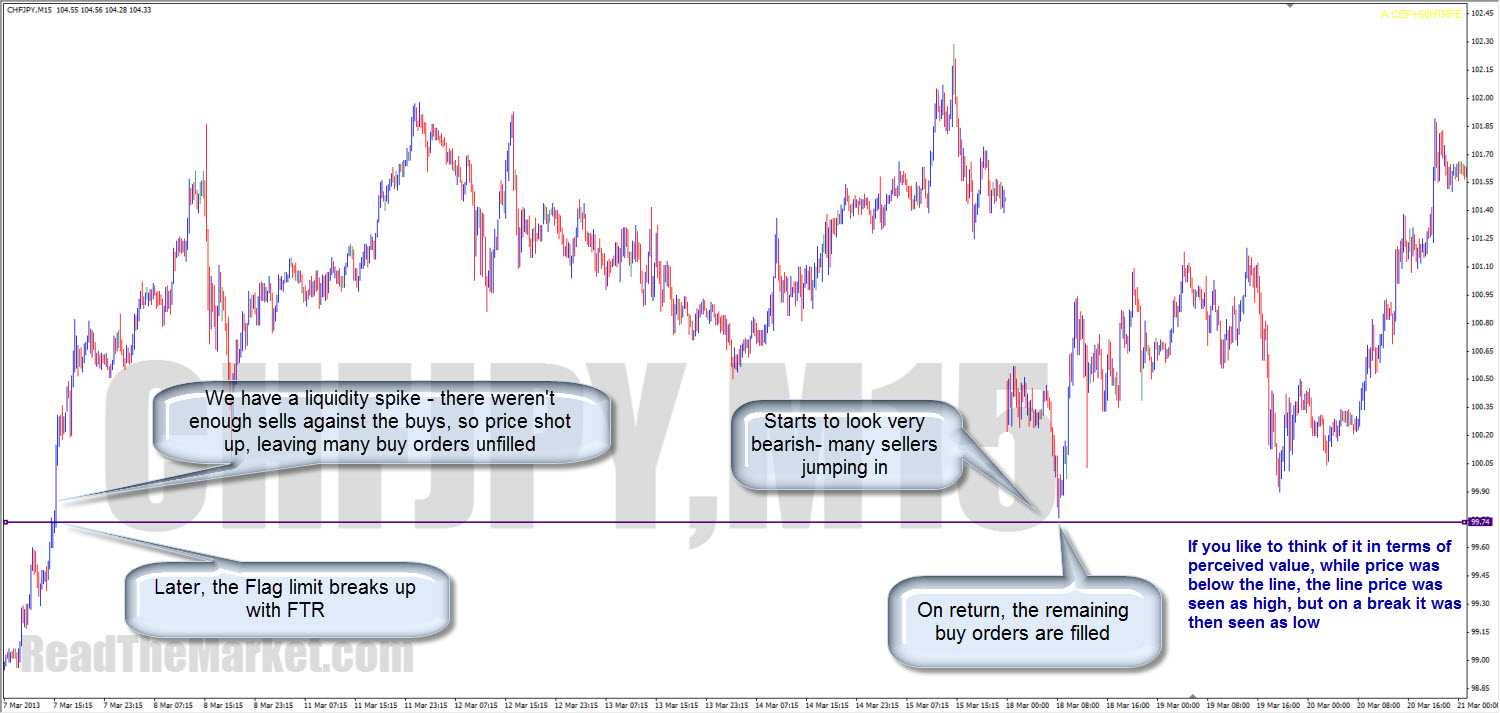
Ask
yourself "Why did price shoot up from there?" You'll answer
"Because someone wanted to buy a lorryload, but there was nobody willing
to sell at that price, so price shot up to find sellers." The next
question you'll ask yourself is "Will he have left orders to buy again at
that price?" The answer is usually "yes". Next question is
"will price reverse from there?" The answer is, "Well, it may
well bounce form there, but we won't know if it'll reverse until an engulf
tells us it's reversed"
Of
course, the extremes in one TF can be midrange in another TF, which is why it's
vital to manage your adds in the lower TF until they break into HTF trades.
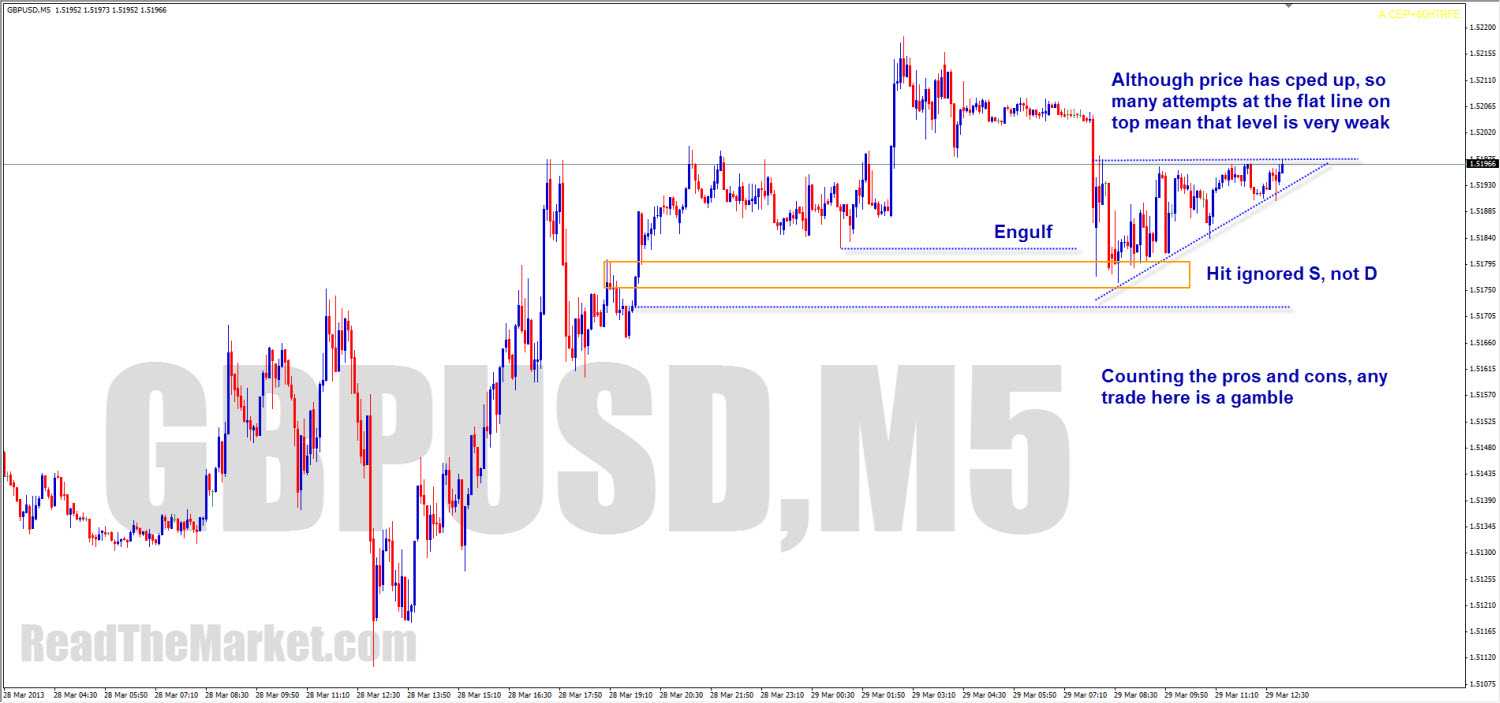
Okay!
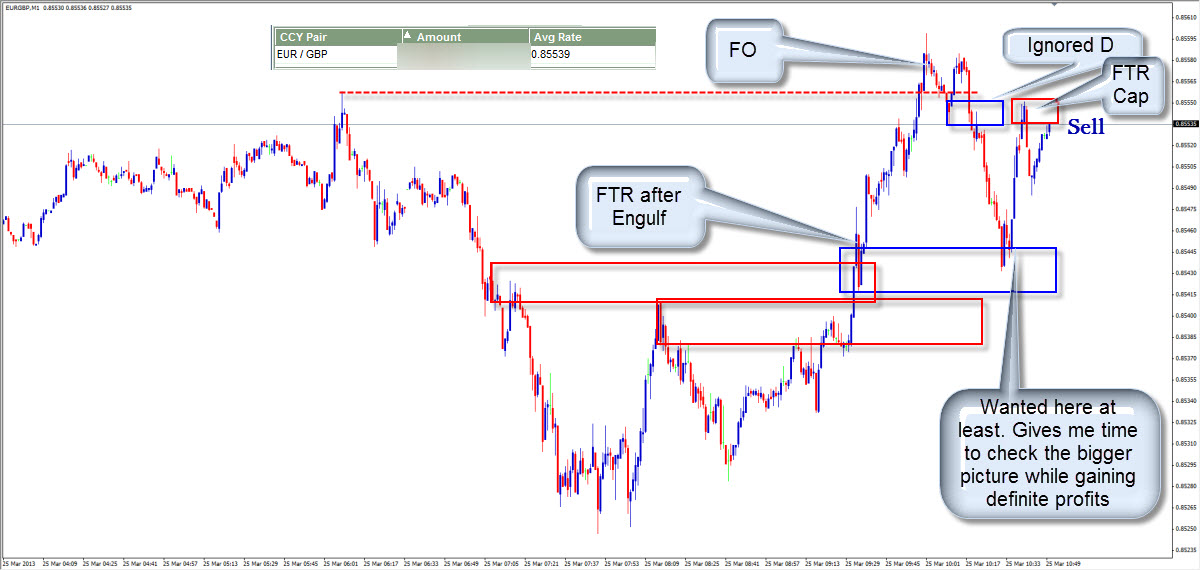
One giant clue: If something which should have been important got ignored, then
it will be given great import on return.
Personally,
I love to dissect the HTF zone, in LTF, and look for a DBR or RBD within it,
where price had broken out of a box and failed to get back in.
Whipsaw
engulfing - a fakeout followed by a quick return breaking the last zone. It's
great PA.
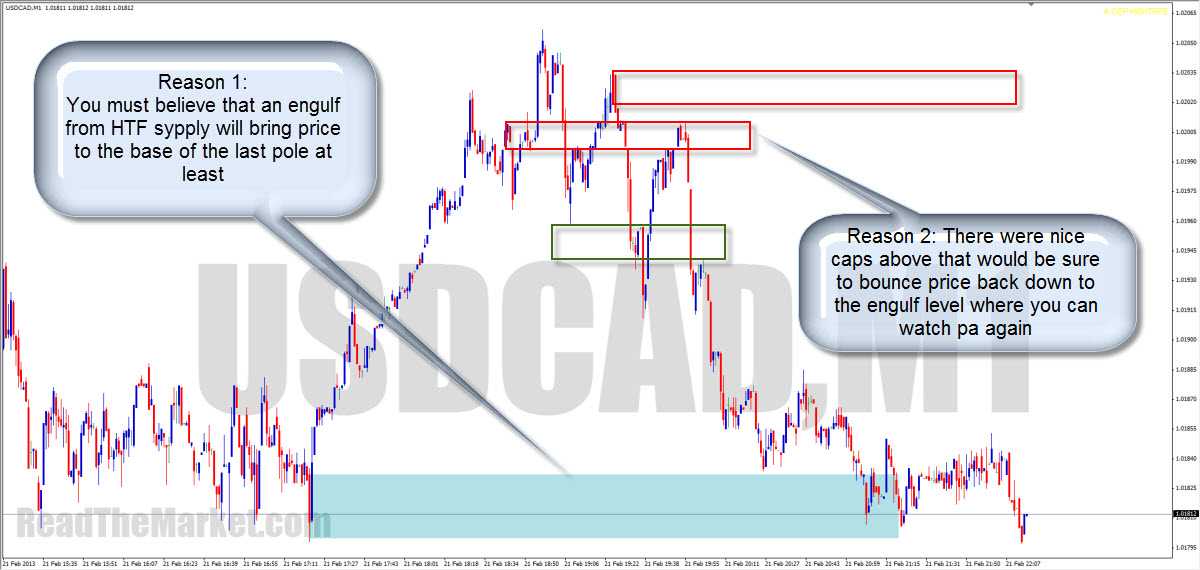
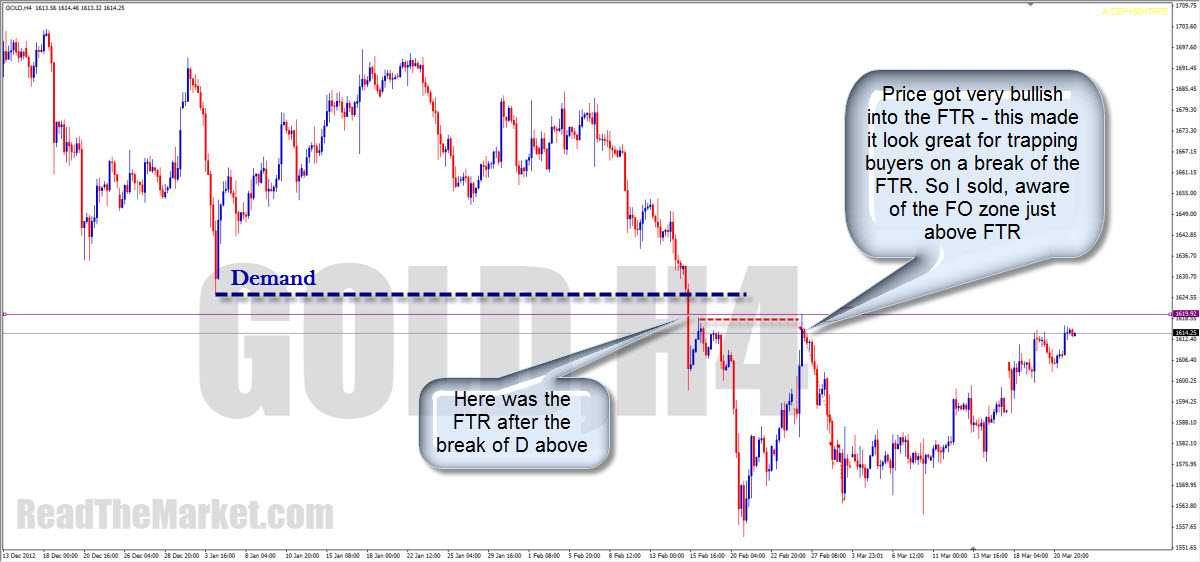
An
excellent Supply or Demand zone is one where the future has already been
written. Having done some study of the markets, we know that once we have an
engulf of a zone, price will want to go to the origin. So we look to where the
trend change was confirmed - FTR.
You
must study the zone which is being reacted to just as much as the reaction
itself.
Just
consider the manipulation of hope and fear at turning points, and you'll have a
very valuable eureka moment.
When
you begin to see the symmetry in the market, you're making one of the final
steps in reading and predicting it.
High
R is High R, and these trades happen with great frequency. I applaud this easy
way of making good money. If you're at the MPL of an HTF level, however, think
about taking enough at LTF tg1 to cover the HTF stop, and letting the trade
run.
A
bit of simple advice, to avoid overtrading and impulse trading: Draw up the
most important looking zones, and look for trades only there.
We
absolutely must have an hard stop, always. But if we don't have an engulf
before entry, we don't put it directly above the high or below the low, where
all the retail stops lie. Instead, we find a lovely LTF RBD/DBR just beyond,
and put it on the other side of that, so that we have the best chance to get out
at BE or in big profit from the usual RT.
There's
no indication that a demand has been respected until the source above has been
engulfed.
When
you begin to see the symmetry in the market, you're making one of the final
steps in reading and predicting it.
one
template from IF: http://readthemarket.com/index.php/forum/homework-rooms/1974-its?limitstart=0#27951
Whenever
you're unsure of a price pattern, search through history for as many instances
of it as you can - find out what triggered it, and what happened next.
The
more times you do this for each pattern, the better equipped you'll be to trade
them live.
From
the Webinar 20/04/2015:
After
a break of an high and therefore a FL formed; we want to see signs that the ITs
HAVE turned price once it gets to this level or whether they are THINKING of
turning these prices once it gets to this level. The safest thing of course is
to wait until they have turned the price at this level and they give you an
easy target to head for.
A
High that engulfed by a Flag Limit supporting the HEAD (head is only confirmed
after FL broken down) is a QM/shoulderlevel to the right.
Look
for a trade in the places where TRICKS have been played in the past and look
for TRICKS to be played there.
TRICK:
High -> Higher High -> Engulf of the High's Low/Support. It s about
catching people getting in buy and dragging them short off the last low of the
High.
TRICK:
bring price shot up and then bring price shot down, IT engulf price UP and then
engulf down. Kinda like whipsaw. This is a brilliant zone to look for a trade
(H to HH area on the left "shoulder") = MPL.
TRICK:
Two Lows, Break Down, Whipsaw Up
Confluence:
Tricked zone (engulfing Support FL supporting the Head, thus a new Resistance
FL, then advance down) being tied nicely in with a bigger tricked zone (or
maybe a left shoulder) = QM lvl. also there might be FL inside it to look for
accuracy.
After
the Break & before advancing, the depth of the retrace = extent of FL box.
Yes,
price is reacting to the QM in LTF scale, in essence price is always reacting
to the HigherTF scale. So we have wide SL, unless we trade in much lower scale.
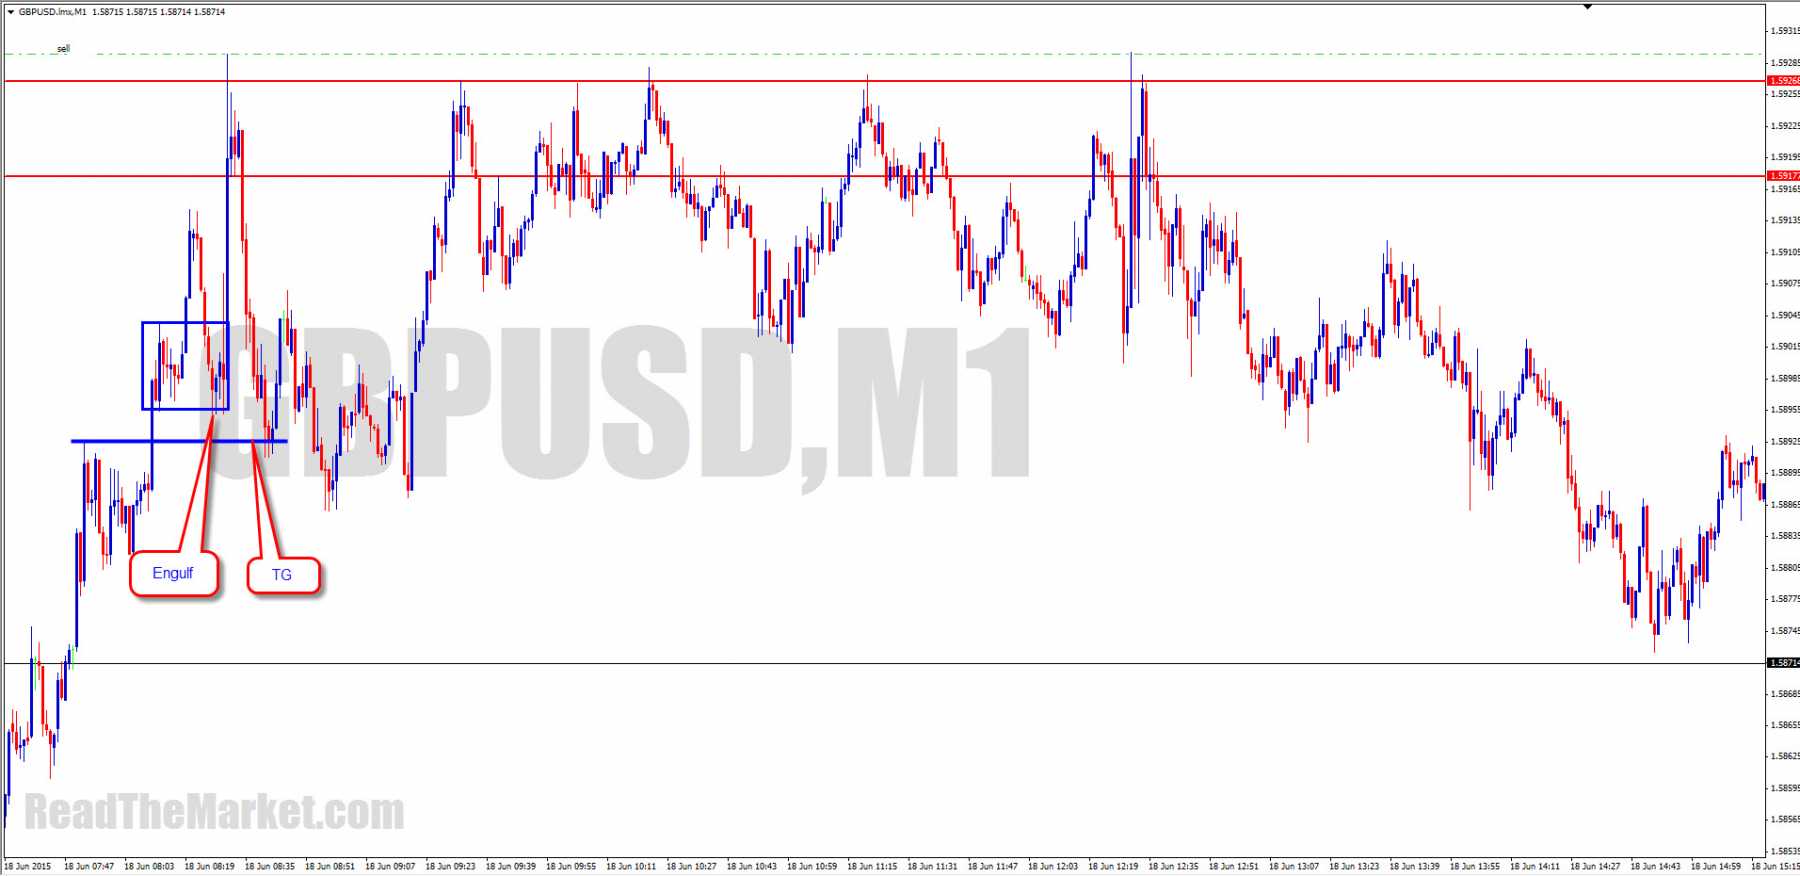
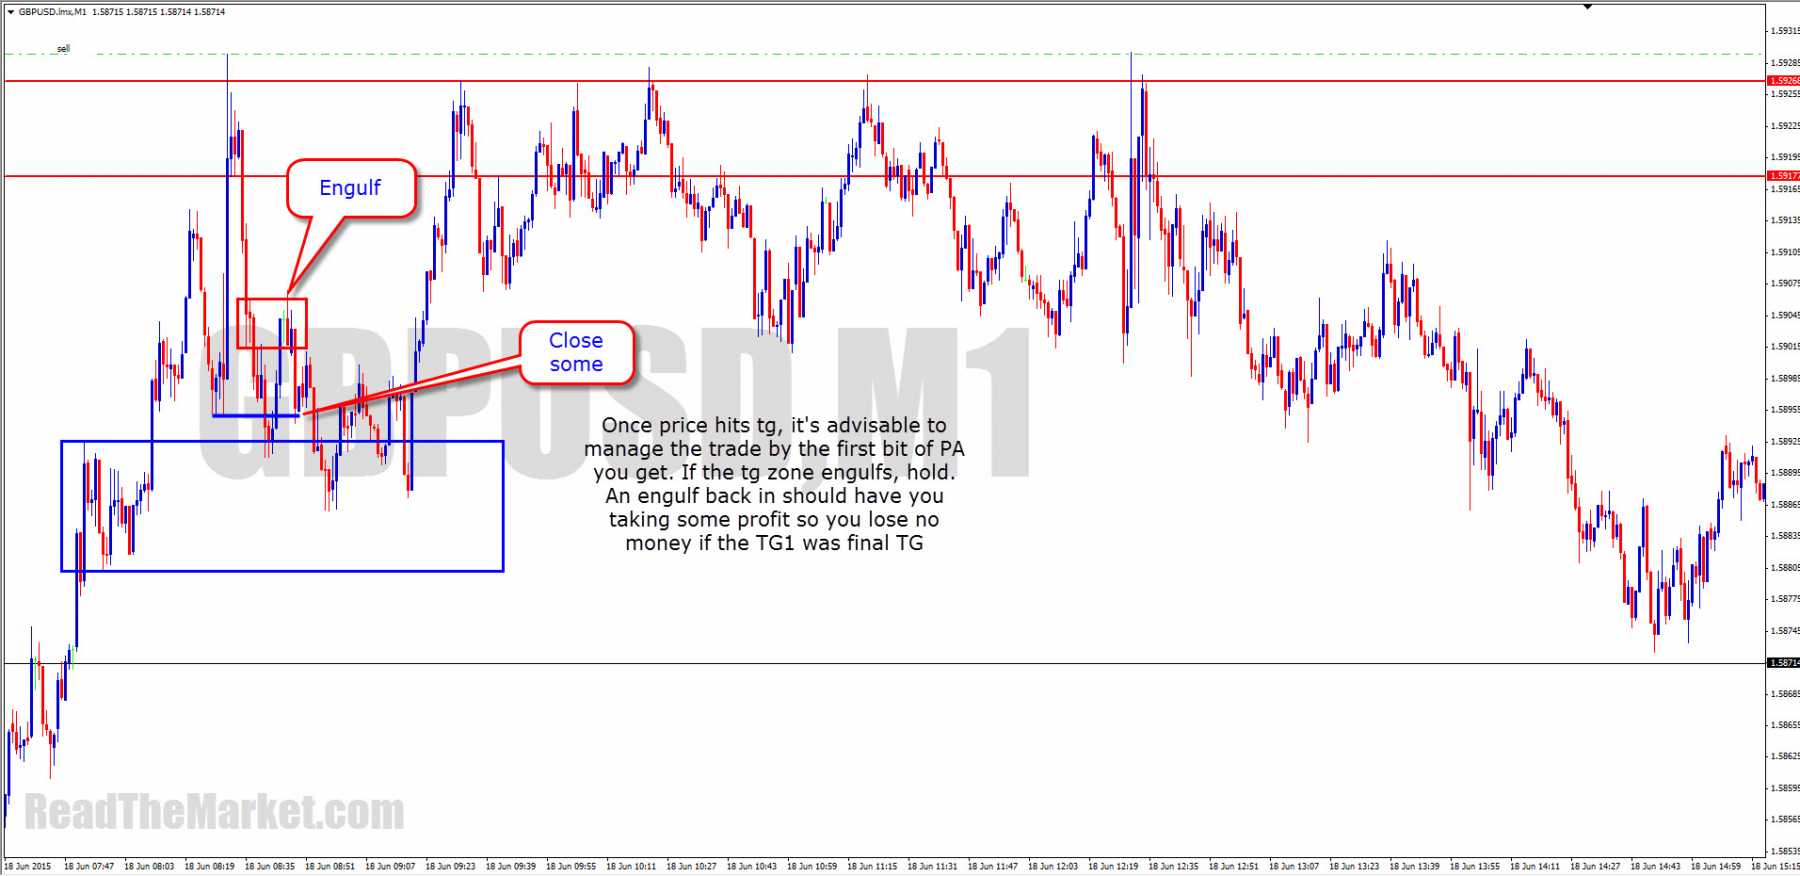
Once
TG hit, IT often moves price away from TG to put our entry under stress and
they can even make a diamond past our entry to turn our hope into fear.
On
approach, look for breaks of highs and lows (esp engulf of low on the way up)
to catch people's SLs and breakout traders, causing confusions, up until price
hit MPL.
Even
if we know where ITs targets are (after ENG), ITs can fill us with so much
hope/fear that we forget the TGs.
***Look
for tricks being played on approach into places where tricks have been played
in the past; look for break down/up then break up/down, look for the same ON
RETURN/approach***. Coming into QM/tricked level, look for highs being broken
and look for a STRONG push-UP, a STRONG PUSH-UP = STRONG BEARISH. Strong
Push-Up past 2 Highs into the place where tricks have been played in the past =
Very Strong Bearish, especially if we have PA before hand (engulf of
low/support before whipsaw UP).
***There
are ways/certain rules of knowing which scale we are working on and how far
price RT before it hits TG, then we know how to put SL.
Long
time to understand which scales we are working in, understand **how far price
can RT once PA has occurred**. To understand how ITs can catch SLs and
Break-out Traders to fulfill their orders.
To
understand how far price can RT is to find out whether or nor there is PA on
approach (engulf of level in the direction aligned with our trades direction
from the zone we find to entry).
Price
can only RT too deep into the extreme limit of the HEAD, if price engulfs or
bounce of the opposite FL into PAZ, opposite to the HEAD.
Of
course if there is no PA to breaking down the lower FL that is in the other end
of this PAZ, then there is no reason for price to Stop and Reverse, let alone
break-through. We need PA to happen to find out if price is going to Stop.
Find
out where Highs/Lows got broken, and next highs/lows broken, spaces within Rectangles
= PAZ.
MPL
= the last whipsaw made before an entire whipsaw was created. The true origin
of a move is at the MPL. where tricks (whipsaws) have been played.
Targets
of short is origin of the move up, Target of long is origin of move down.
IF's JOURNAL REFs
https://readthemarket.com/index.php/en/forum/journals/1523-if?start=550#25832
Support and resistance was a great start, and then Supply and Demand added to it nicely.
Price action patterns became the next great tool.
By the time I wrote the Price Reading article, I had finished learning all the technical aspects of the market, and was ready for the most important part of Price Reading - understanding the mind and needs of the IT.
This was the quantum leap that got me totally at one with the market.
I was no longer looking at the market in any technical manner, but, having learned the rules the ITs live by, and the tricks they play on retail traders, was able to simply trade as one of them.
So, to answer your question - when I look at the charts, I look at exactly the same things I have taught in the fora, but I see them through the eyes of the people who created them, rather than in the abstract manner of a technical analyst.
The leap from analyst to Price Reader is a very simple one, and in RTM I've brought everyone right to the edge.
What I haven't taught publicly is that which I want you to understand for yourselves: the psychology behind price movement.
https://readthemarket.com/index.php/en/forum/journals/1523-if?start=575#25926
The object of this exercise though is to read ALL the PA you were given, and to think of the signals the ITs give each other, and to consider the tricks they play to get as many of them in at the best possible price.
https://readthemarket.com/index.php/en/forum/journals/1523-if?start=50#12897
Just know they've got orders to fill at a level, watch them fill some on approach (CP), see the momentum, and watch them come back to fill more orders 'til they've had their fill.
https://readthemarket.com/index.php/en/forum/journals/1523-if?start=50#12946
https://readthemarket.com/index.php/en/forum/journals/1523-if?start=50#12961
We're always looking for signs of what the big guys are doing at significant areas, and if we don't see what they're doing, there's no trade
So, on approach, if we see the big guys trying to hide their orders in the market, we see compression, and can feel pretty sure of their intentions - to get in as many orders as they can before the turn
If we don't see this, we can be pretty sure that it won't just turn immediately, as there usually won't be enough orders against them to fill all the orders they must fill.
This is why we wait for an engulf. This shows their intention to reverse price. Then we watch them trying to hide their orders in the market on a retrace, ready to take price to the origin of the move
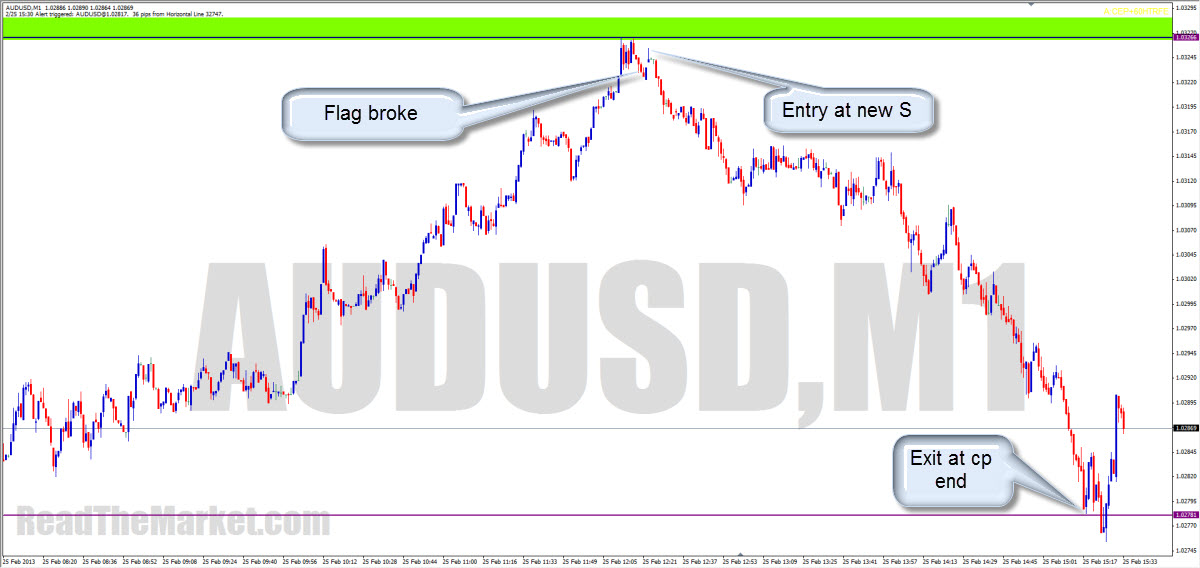
Pete, when we see decent CP coming into the base of a pole, we are very often safe to touch trade the base.
The safest thing to do however is to await the first engulf into the cp zone as confirmation.
I can't tell you which way to trade it, as people's psyches vary
https://readthemarket.com/index.php/en/forum/journals/1523-if?start=75#13527
https://readthemarket.com/index.php/en/forum/journals/1523-if?start=75#13667
https://readthemarket.com/index.php/en/forum/journals/1523-if?start=75#13809
https://readthemarket.com/index.php/en/forum/journals/1523-if?start=75#13825
https://readthemarket.com/index.php/en/forum/journals/1523-if?start=75#14051

https://readthemarket.com/index.php/en/forum/journals/1523-if?start=75#14228
https://readthemarket.com/index.php/en/forum/journals/1523-if?start=100#14274
Very often a zone will break strongly and price will retrace but fail to retouch it. This is still the FTR - the confirmation of a new trend (do a study of how price reacts and how far it goes after hitting this spot). So an FTR can be first time back, but doesn't need to be.
https://readthemarket.com/index.php/en/forum/journals/1523-if?start=100#14723
https://readthemarket.com/index.php/en/forum/journals/1523-if?start=100#14862

https://readthemarket.com/index.php/en/forum/journals/1523-if?start=100#14904
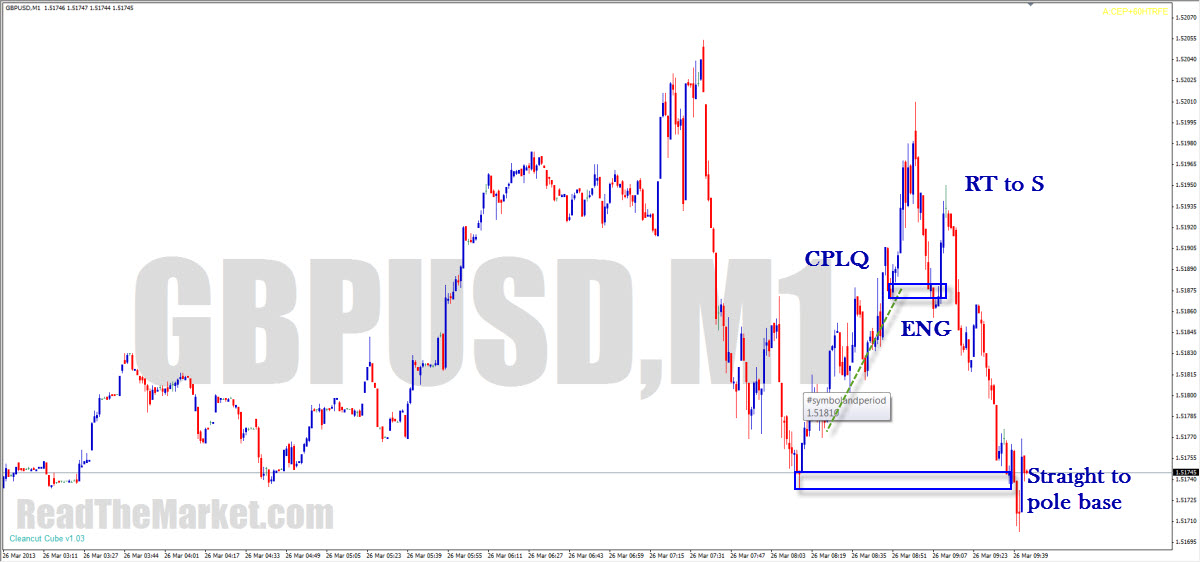
Put together CPLQ and an engulf, and you're bound to hit the pole base
https://readthemarket.com/index.php/en/forum/journals/1523-if?start=100#15102
https://readthemarket.com/index.php/en/forum/journals/1523-if?start=100#15105
During holidays, volume in the market is often greatly diminished
This would lead some to imagine that price hardly moves
But
Say someone decided to put a truckload of orders into the market. If there's nobody else in the market to oppose these orders, price can do nothing but shoot away.
So remember
Low Volume can = High Volatility
https://readthemarket.com/index.php/en/forum/journals/1523-if?start=125#15453
We look for engulfs of important decision points. The engulfs are strengthened by FTRs, putting caps on price. Basically it's all as simple as that :)
https://readthemarket.com/index.php/en/forum/journals/1523-if?start=125#15917
https://readthemarket.com/index.php/en/forum/journals/1523-if?start=150#17805
https://readthemarket.com/index.php/en/forum/journals/1523-if?start=175#18109
https://readthemarket.com/index.php/en/forum/journals/1523-if?start=175#18114
https://readthemarket.com/index.php/en/forum/journals/1523-if?start=175#18119
https://readthemarket.com/index.php/en/forum/journals/1523-if?start=175#18195
https://readthemarket.com/index.php/en/forum/journals/1523-if?start=175#18423
https://readthemarket.com/index.php/en/forum/journals/1523-if?start=175#18424
https://readthemarket.com/index.php/en/forum/journals/1523-if?start=200#18592
https://readthemarket.com/index.php/en/forum/journals/1523-if?start=225#18734

https://readthemarket.com/index.php/en/forum/journals/1523-if?start=225#18740
https://readthemarket.com/index.php/en/forum/journals/1523-if?start=225#18907
https://readthemarket.com/index.php/en/forum/journals/1523-if?start=225#18946
https://readthemarket.com/index.php/en/forum/journals/1523-if?start=225#19004
https://readthemarket.com/index.php/en/forum/journals/1523-if?start=250#19351
https://readthemarket.com/index.php/en/forum/journals/1523-if?start=250#19544
https://readthemarket.com/index.php/en/forum/journals/1523-if?start=250#19701
https://readthemarket.com/index.php/en/forum/journals/1523-if?start=275#19980
https://readthemarket.com/index.php/en/forum/journals/1523-if?start=275#19982
https://readthemarket.com/index.php/en/forum/journals/1523-if?start=275#20093
Yes peeps, keep it simple
PAZs are the spaces between FTRs. They're the spaces in which flags form
https://readthemarket.com/index.php/en/forum/journals/1523-if?start=300#20322
https://readthemarket.com/index.php/en/forum/journals/1523-if?start=300#20376
https://readthemarket.com/index.php/en/forum/journals/1523-if?start=300#20854
https://readthemarket.com/index.php/en/forum/journals/1523-if?start=325#20975
https://readthemarket.com/index.php/en/forum/journals/1523-if?start=325#21048
https://readthemarket.com/index.php/en/forum/journals/1523-if?start=325#21060
https://readthemarket.com/index.php/en/forum/journals/1523-if?start=325#21064
I never expect anything to break - hope is the heretofore unmentioned of the 3 banes of the trader.
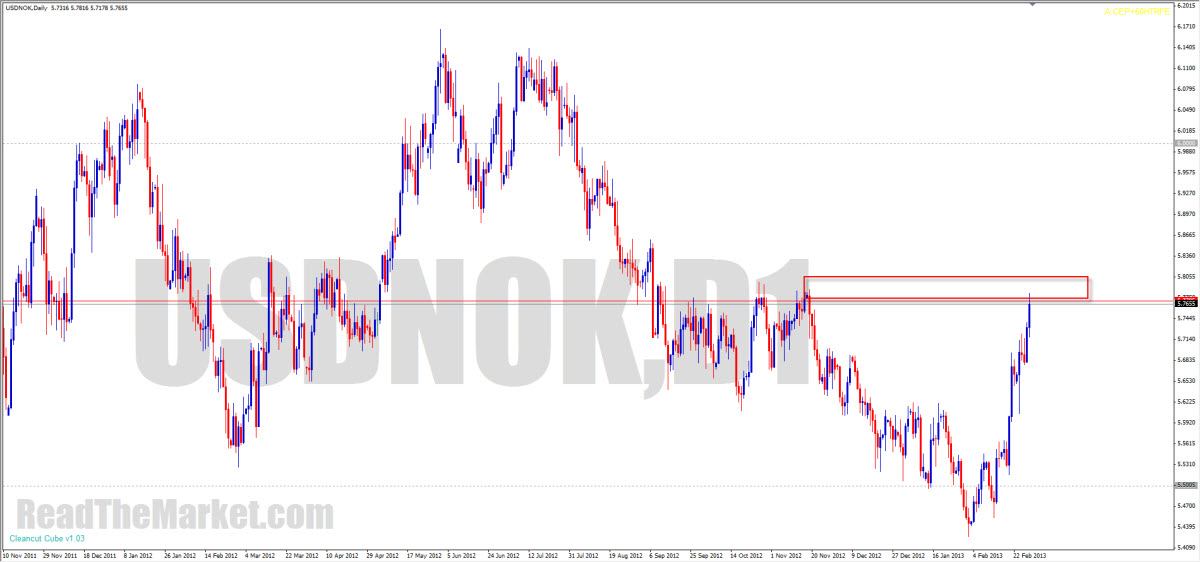
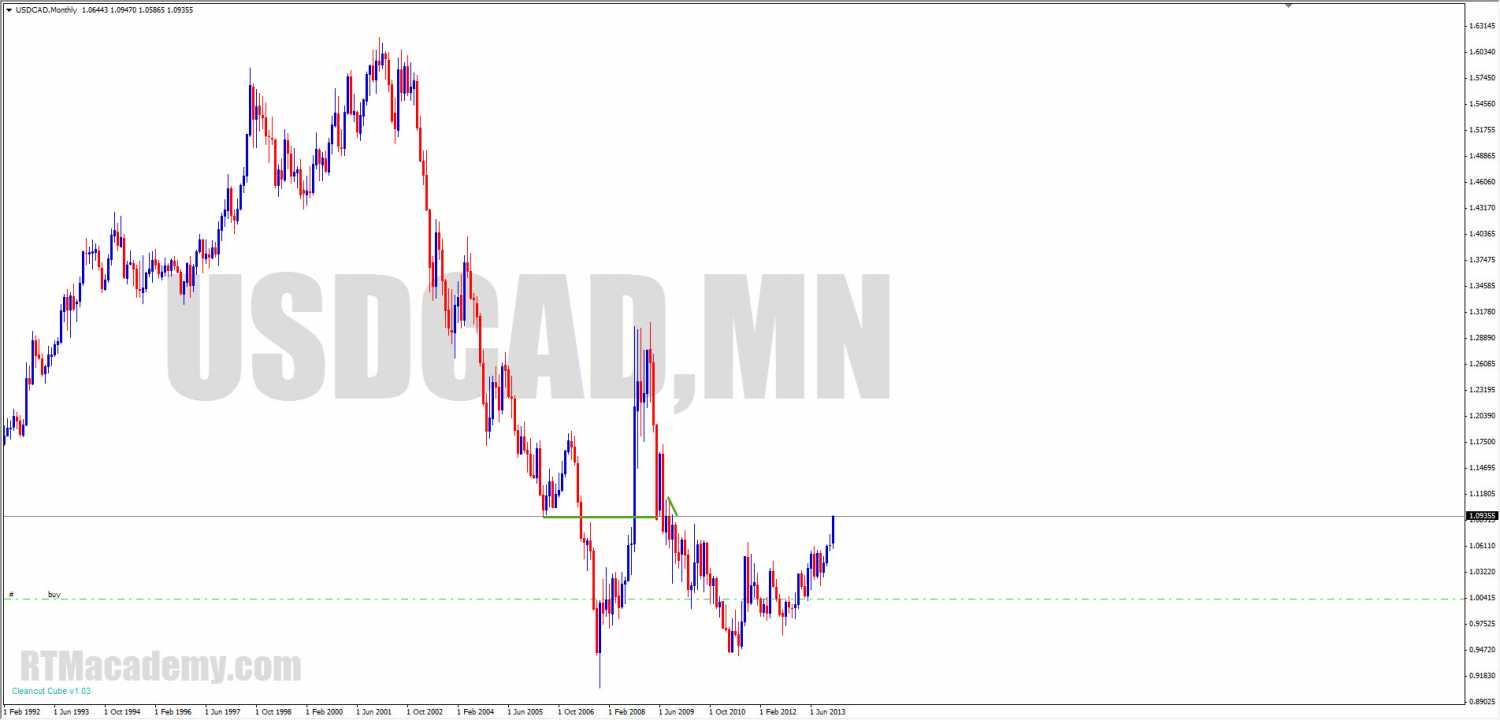
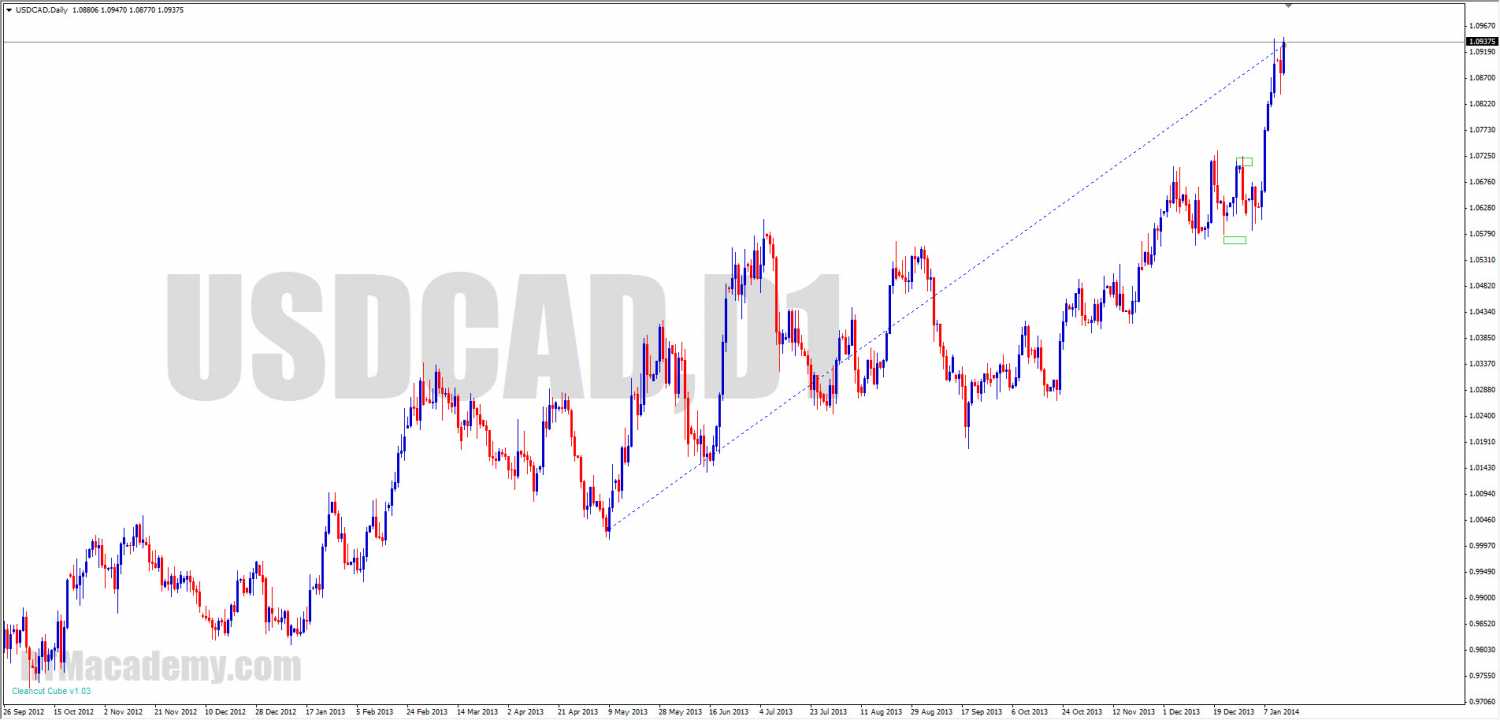
If you look at monthly, it bounced down pre cp, as you'd expect, and then bounced back up from RS
It can sit an flag on that - your FL is well marked, or it can advance down to D
Your FL is key to what will happen next
https://readthemarket.com/index.php/en/forum/journals/1523-if?start=325#21084
https://readthemarket.com/index.php/en/forum/journals/1523-if?start=325#21086
https://readthemarket.com/index.php/en/forum/journals/1523-if?start=425#22060
https://readthemarket.com/index.php/en/forum/journals/1523-if?start=425#22485
https://readthemarket.com/index.php/en/forum/journals/1523-if?start=450#22677
https://readthemarket.com/index.php/en/forum/journals/1523-if?start=450#22713
Most of my analysis comes in after the trade is entered.
Before taking the trade, I do as you said - simple - it's really easy to find pockets of orders which will bounce price, and if they happen to be at great htf levels, even better - there's the highest chance of them giving maximum pips.
What I do certainly looks like touch trading - picking tops and bottoms, but what you said belies that. These are not tops and bottoms, but retraces to the best price to re enter.
Once I'm in though, I'm never guaranteed massive returns - sure price will bounce where I enter, but I'm never complacent until I've seen the engulf. In fact, I'm never really complacent at all. If PA tells me to get out, I must get out!
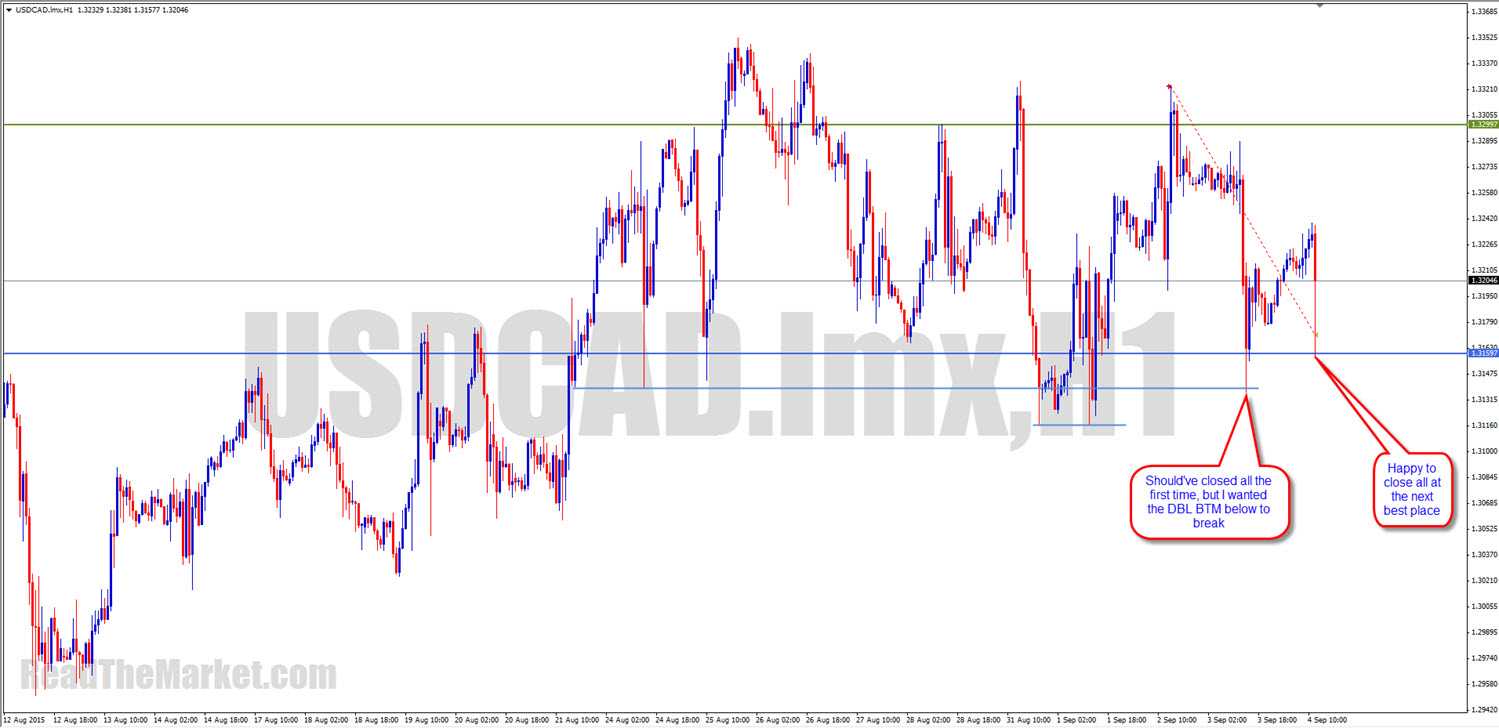
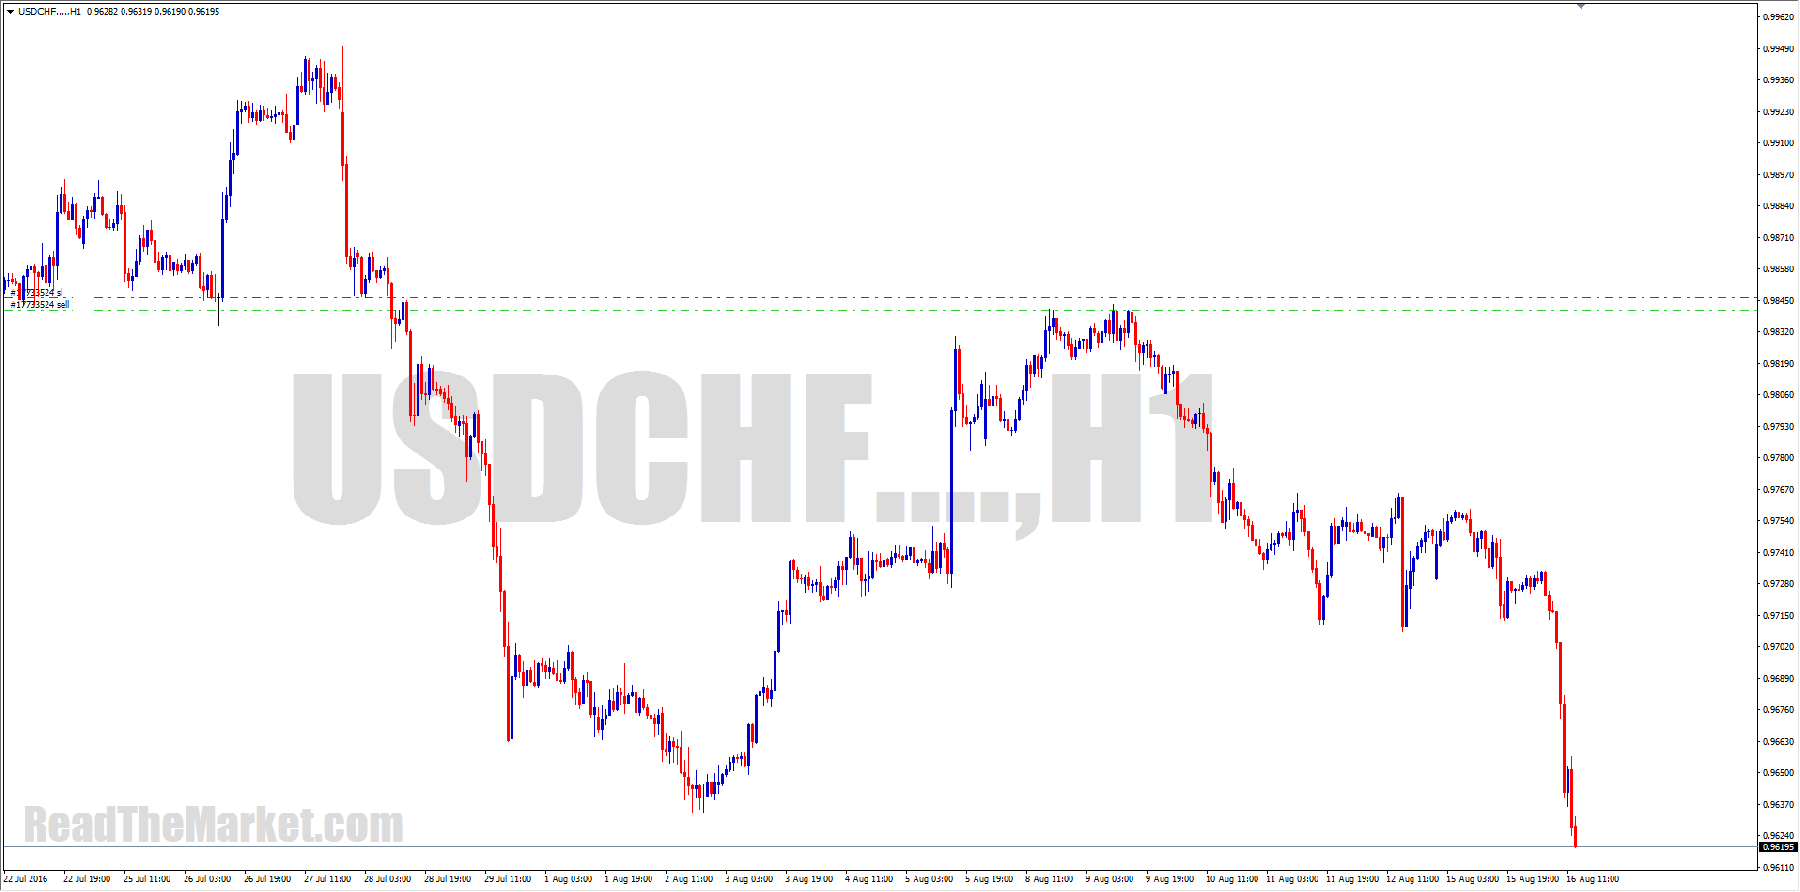
https://readthemarket.com/index.php/en/forum/journals/1523-if?start=450#22736
PA told me it was time to close EJ for now
I had added at the FTR, but the FTR got breached. So I held both down to the last FTR and exited
https://readthemarket.com/index.php/en/forum/journals/1523-if?start=475#23151
https://readthemarket.com/index.php/en/forum/journals/1523-if?start=500#23161
https://readthemarket.com/index.php/en/forum/journals/1523-if?start=500#23197
https://readthemarket.com/index.php/en/forum/journals/1523-if?start=500#23334
https://readthemarket.com/index.php/en/forum/journals/1523-if?start=500#25010
There was no need to watch HTF on this. It was all very simple as it was
https://readthemarket.com/index.php/en/forum/journals/1523-if?start=500#25102
Certainly while learning we look for recurring patterns in the market. But once we understand them, what becomes most important is WHY the ITs made them.
It's paramount to understand that it's not enough for the ITs to simply move price. They must also get massive amounts of orders filled in order to make maximum gains. They must also refrain from giving other ITs false signals, which could ultimately cause chaos for everybody.
Think of these things as you study, and you'll be able to get into the mind of the market mover
https://readthemarket.com/index.php/en/forum/journals/1523-if?start=550#25832
Since my first days at FF, I've been adding to my understanding of market dynamics.
Support and resistance was a great start, and then Supply and Demand added to it nicely.
Price action patterns became the next great tool.
By the time I wrote the Price Reading article, I had finished learning all the technical aspects of the market, and was ready for the most important part of Price Reading - understanding the mind and needs of the IT.
This was the quantum leap that got me totally at one with the market.
I was no longer looking at the market in any technical manner, but, having learned the rules the ITs live by, and the tricks they play on retail traders, was able to simply trade as one of them.
So, to answer your question - when I look at the charts, I look at exactly the same things I have taught in the fora, but I see them through the eyes of the people who created them, rather than in the abstract manner of a technical analyst.
The leap from analyst to Price Reader is a very simple one, and in RTM I've brought everyone right to the edge.
What I haven't taught publicly is that which I want you to understand for yourselves: the psychology behind price movement.
https://readthemarket.com/index.php/en/forum/journals/1523-if?start=600#26973
https://readthemarket.com/index.php/en/forum/journals/1523-if?start=625#28011
https://readthemarket.com/index.php/en/forum/journals/1523-if?start=650#28501
https://readthemarket.com/index.php/en/forum/journals/1523-if?start=650#28505

https://readthemarket.com/index.php/en/forum/journals/1523-if?start=700#28938
https://readthemarket.com/index.php/en/forum/journals/1523-if?start=725#30216
No trade management is due until either line breaks
https://readthemarket.com/index.php/en/forum/journals/1523-if?start=750#30319
https://readthemarket.com/index.php/en/forum/journals/1523-if?start=750#30586

https://readthemarket.com/index.php/en/forum/journals/1523-if?start=775#30835
If price reaches its target and then engulfs back in, a reversal has occurred - price will now have a target within the pole that took it to where it turned, so why not trade it back to that TG? If it's not the ultimate target which has been hit (PA in an HTF has told you that it has further to go), and you only like to trade the big moves in the HTFs, then there's no need to take the definite pips on offer here, as it obviously isn't part of your trade plan
https://readthemarket.com/index.php/en/forum/journals/1523-if?start=800#33686
https://readthemarket.com/index.php/en/forum/journals/1523-if?start=800#33703

https://readthemarket.com/index.php/en/forum/journals/1523-if?start=800#33809
https://readthemarket.com/index.php/en/forum/journals/1523-if?start=800#33813
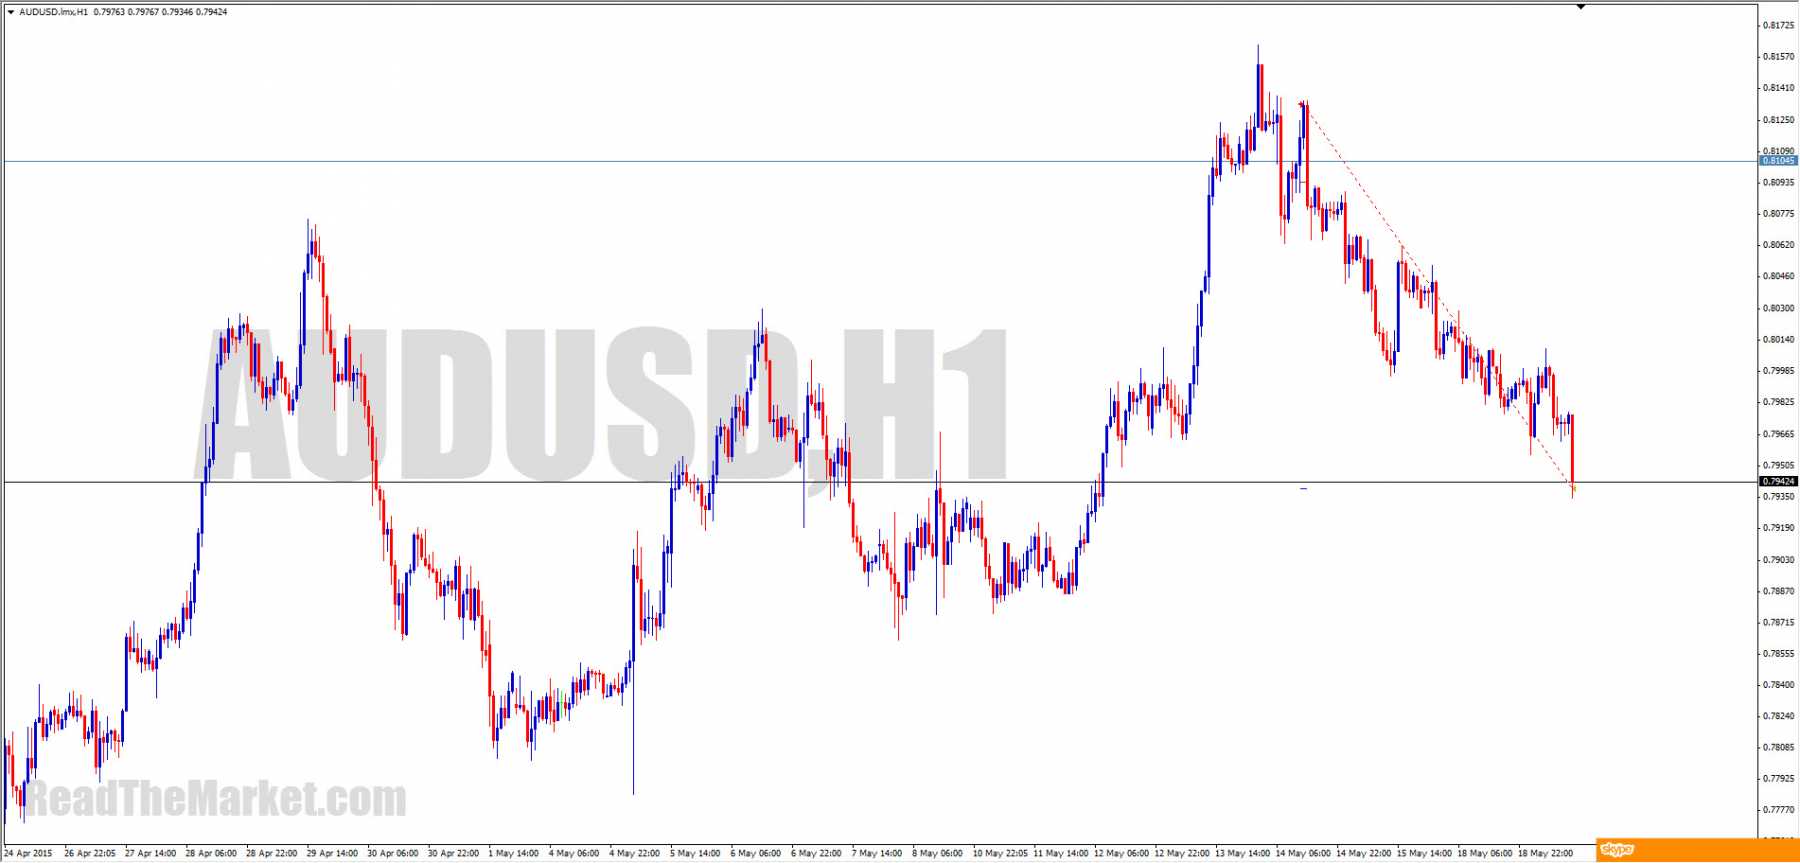
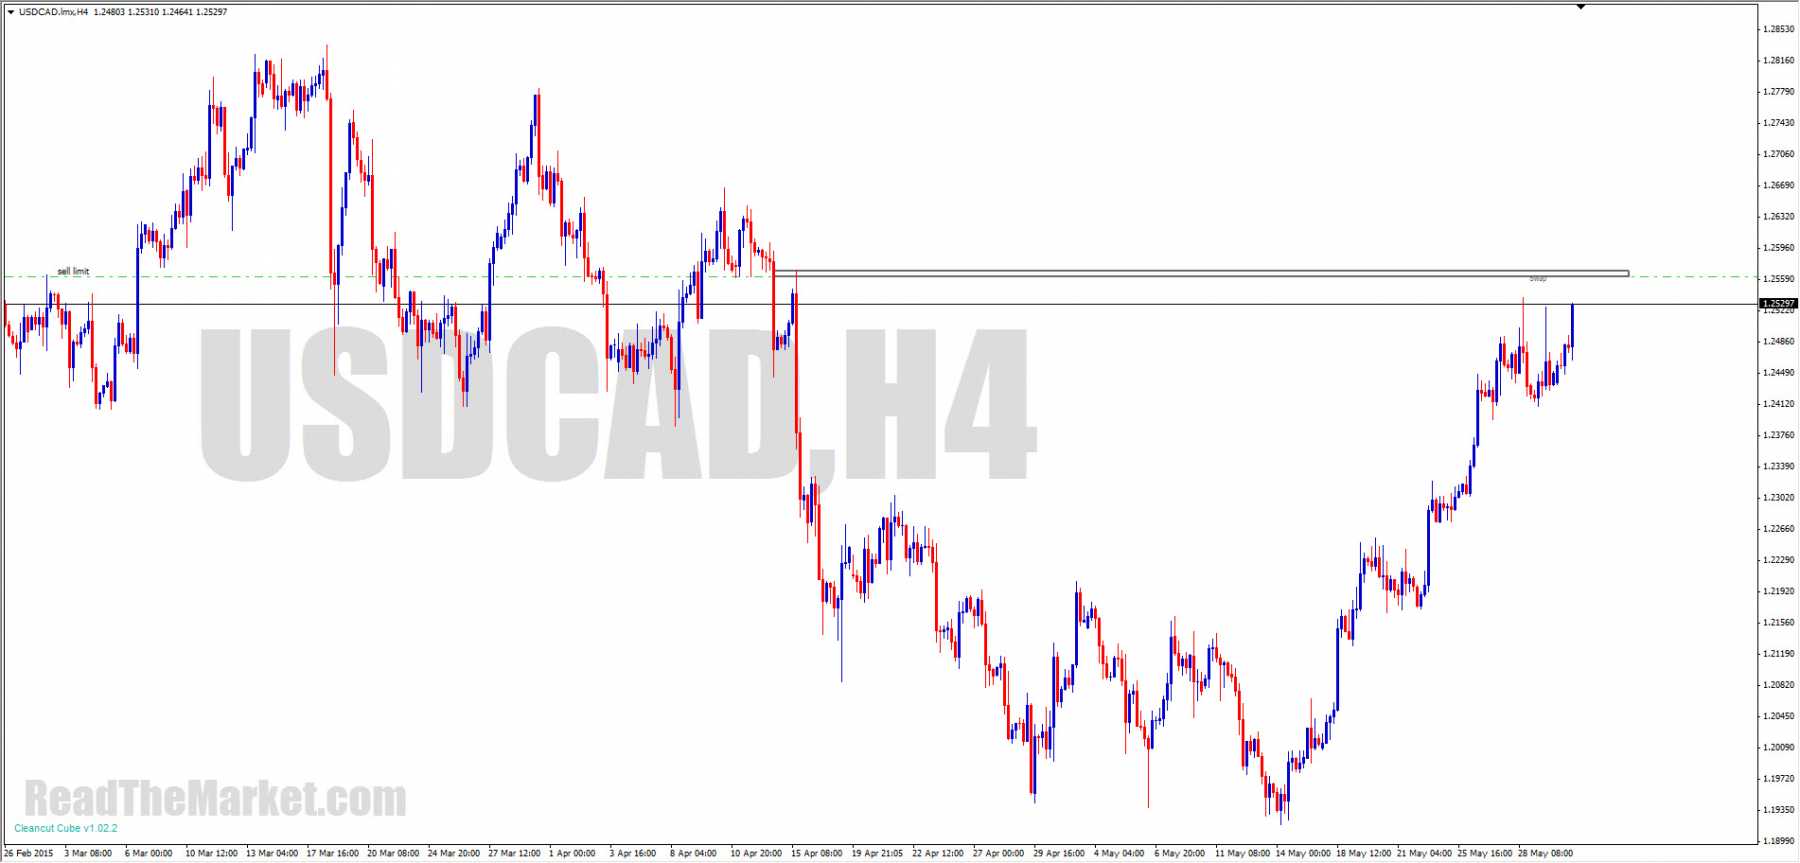
I just can't say publicly where the stop is, but it's not far away
I see price heading further north during the summer, so I'll simply be watching PA on this, level by level. Once I get the PA to exit, I'll await a perfect long entry and swap
https://readthemarket.com/index.php/en/forum/journals/1523-if?start=825#33950
https://readthemarket.com/index.php/en/forum/journals/1523-if?start=825#35398
https://
 readthemarket.com/index.php/en/forum/journals/1523-if?start=850#35650
https://readthemarket.com/index.php/en/forum/journals/1523-if?start=875#35990
https://readthemarket.com/index.php/en/forum/journals/1523-if?start=875#36061
https://readthemarket.com/index.php/en/forum/journals/1523-if?start=900#36483
https://readthemarket.com/index.php/en/forum/journals/1523-if?start=900#36632
Long ago I gave up on the idea that the orders have literally been lying there since the move was made.
In the short term, sure it may be the case, but in the very long term, I think probably not.
That point is moot, however, as the orders tend to get put there before price arrives again.
When the ITs make trade plans, they look for levels to work from and to. They don't just target the middle of space to take profits and turn; they look for a place with history.
Any IT worth his salt will always know where the main mover is taking price to.
It's simply a club. Don't forget that!
https://readthemarket.com/index.php/en/forum/journals/1523-if?start=925#37335
https://readthemarket.com/index.php/en/forum/journals/1523-if?start=950#39409
https://readthemarket.com/index.php/en/forum/journals/1523-if?start=950#39429
https://readthemarket.com/index.php/en/forum/journals/1523-if?start=1025#40315
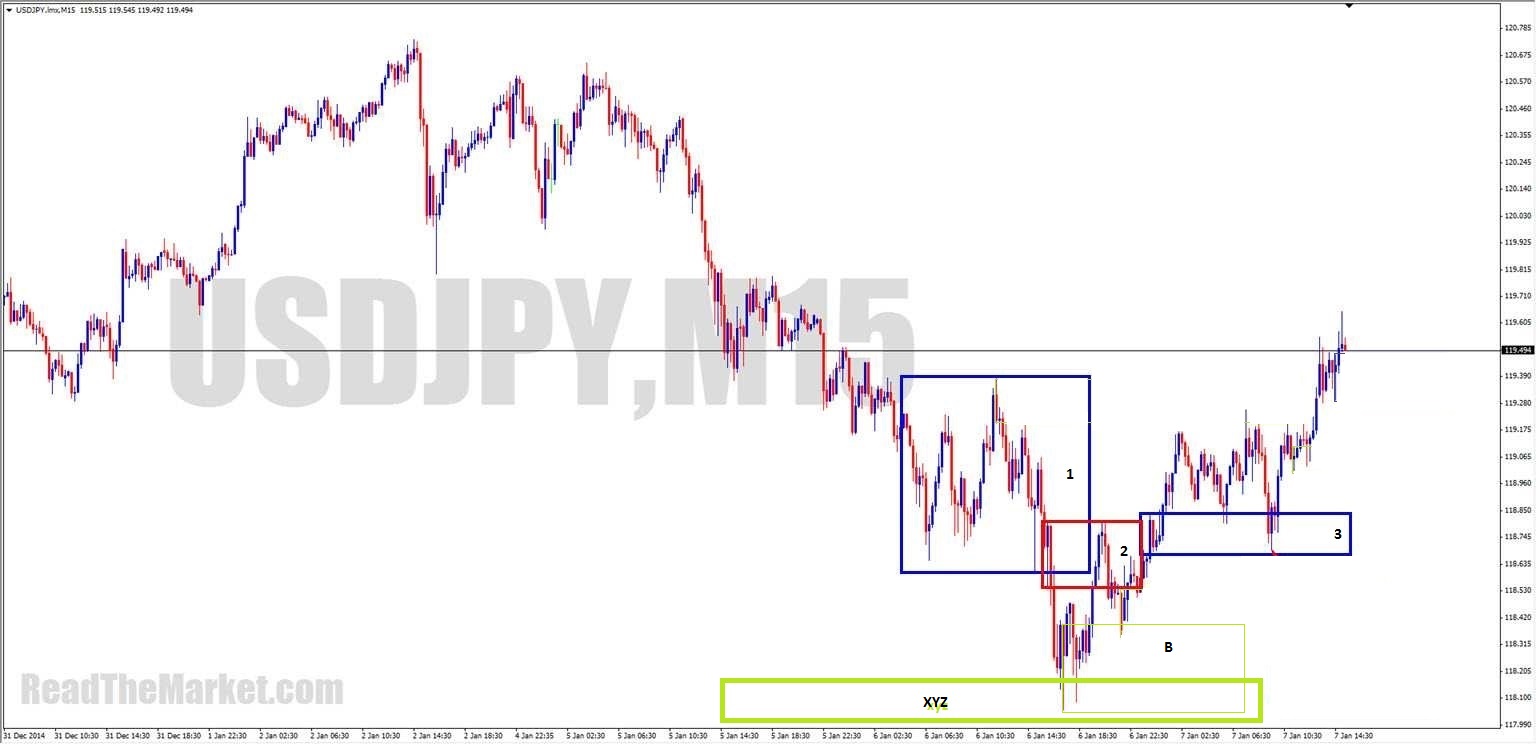
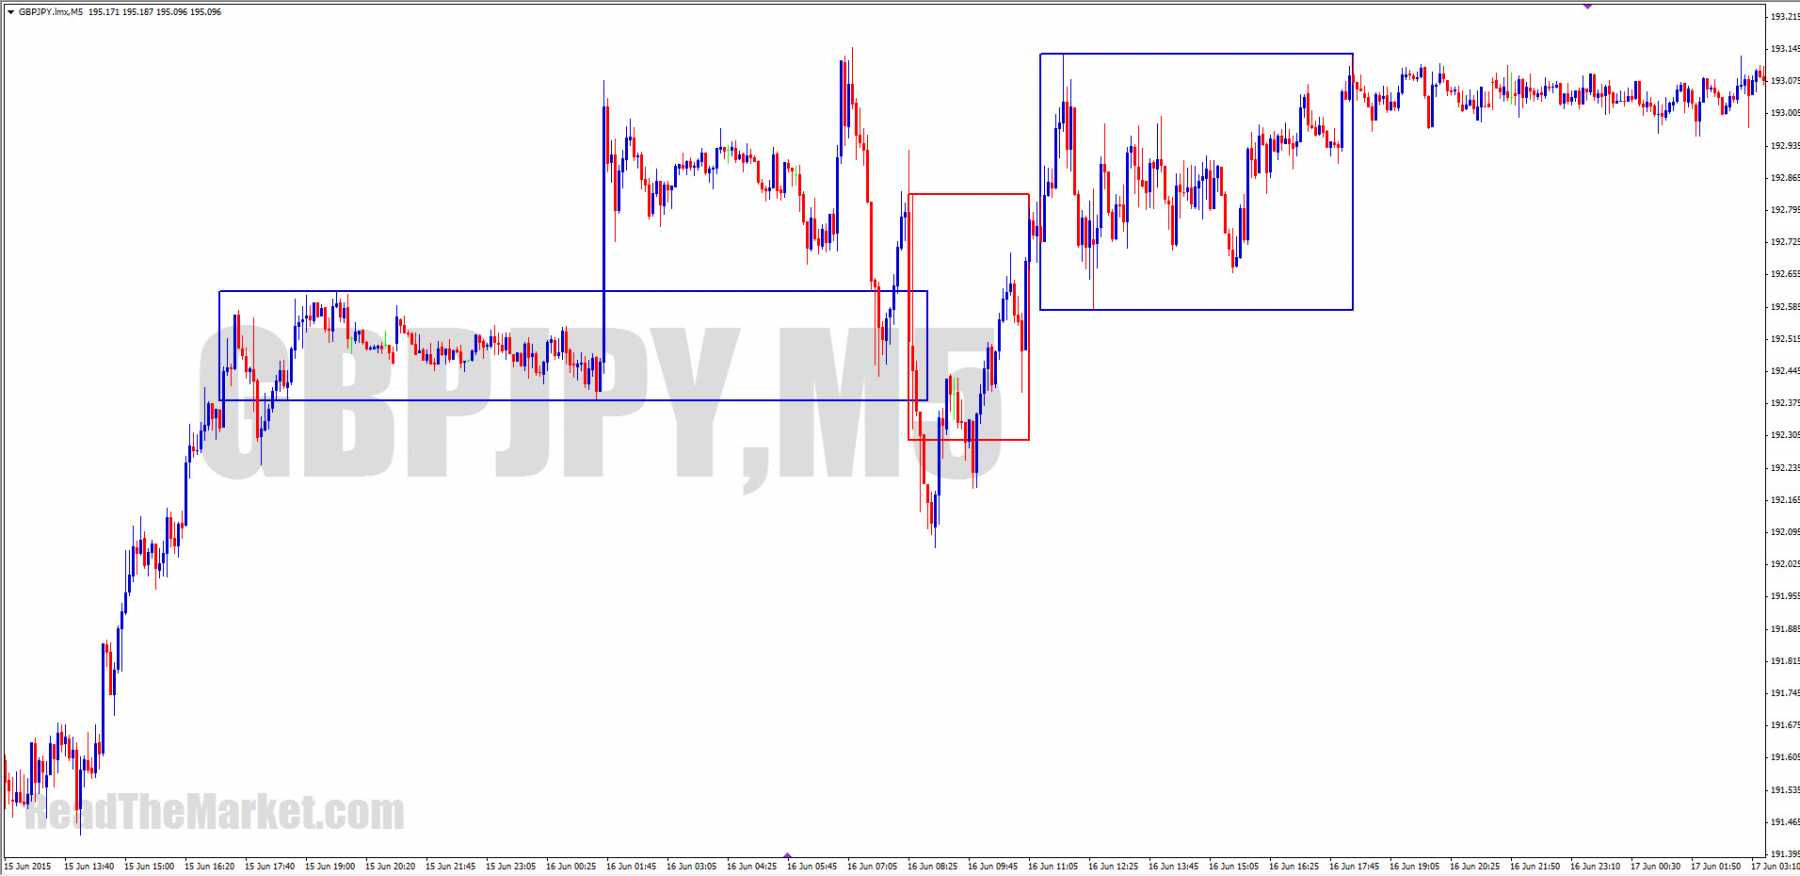
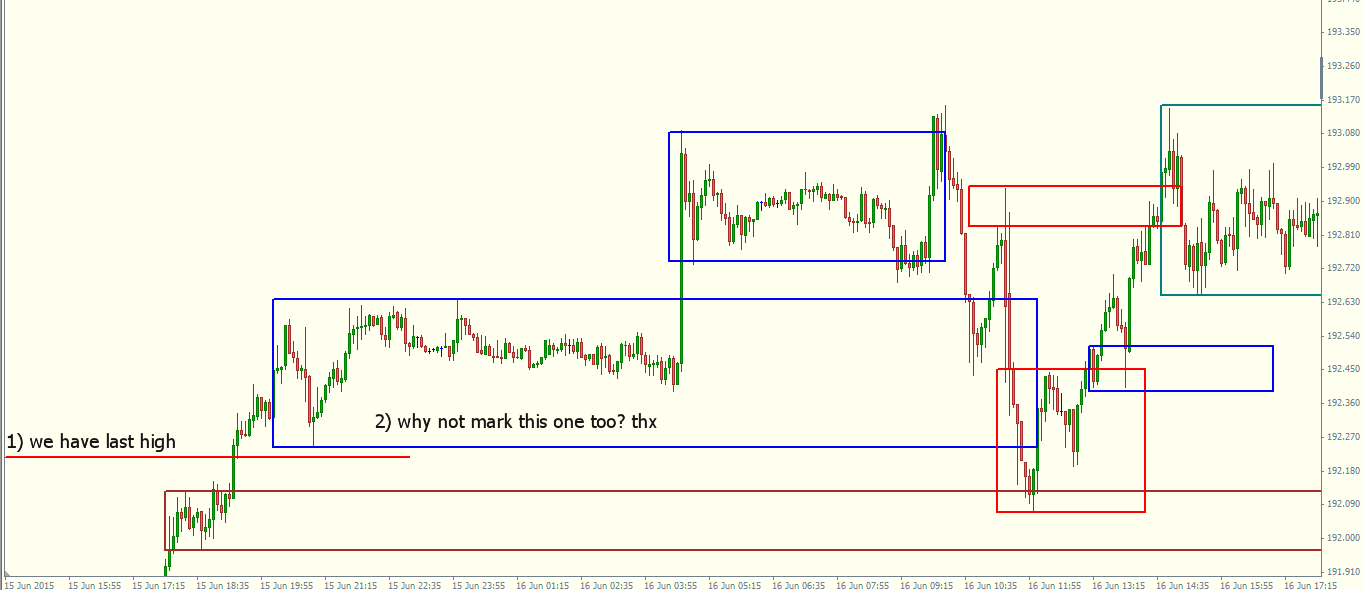
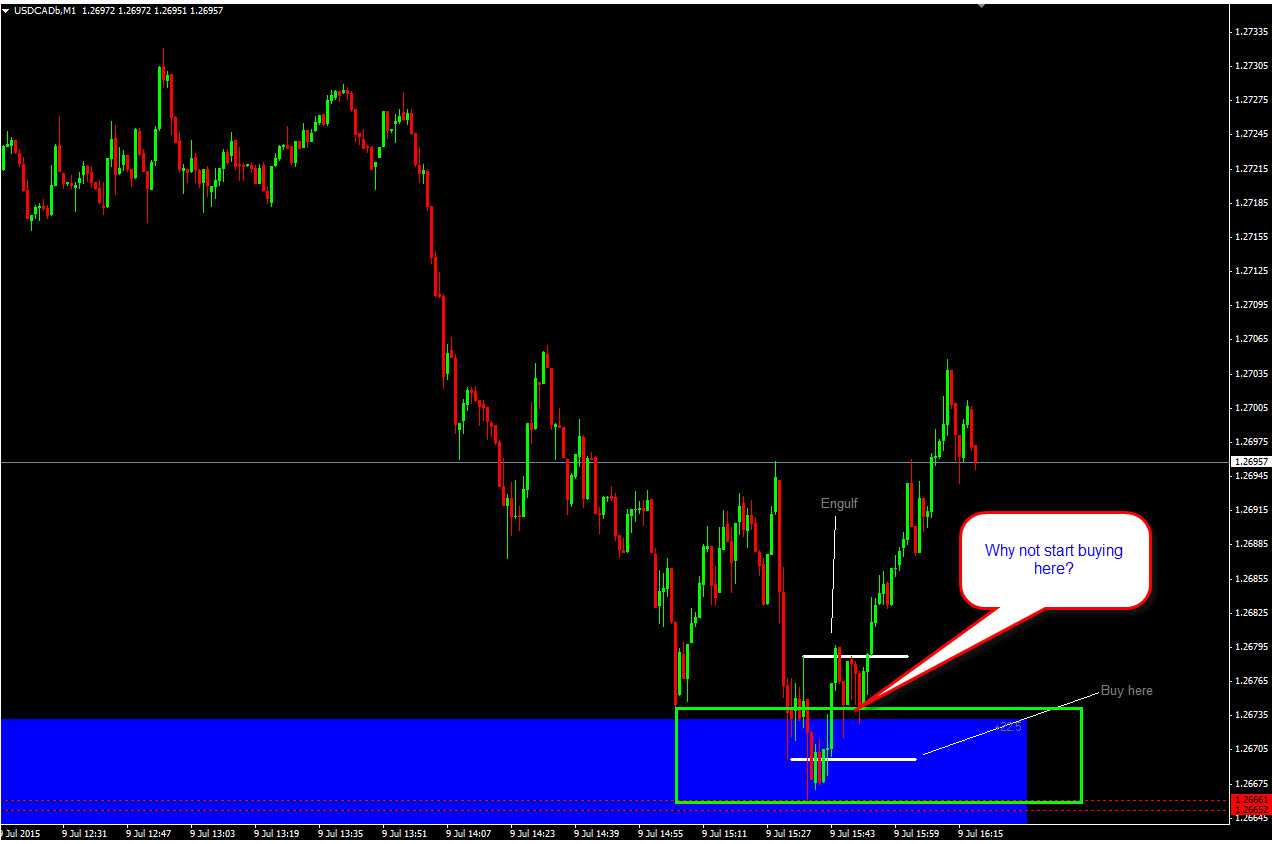
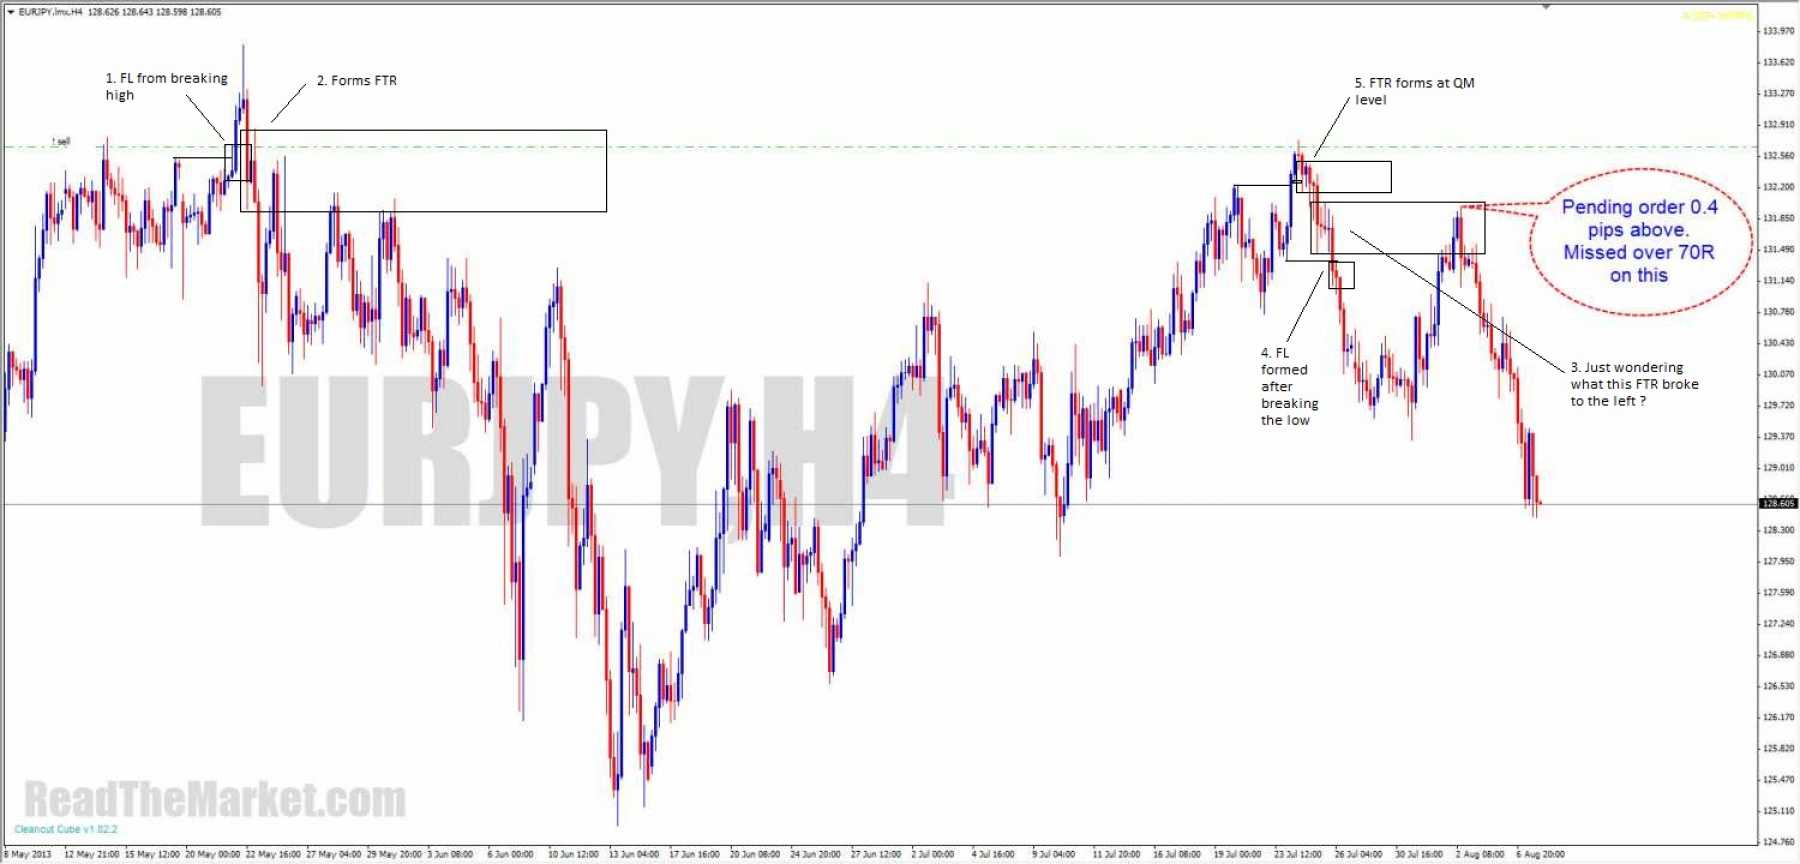
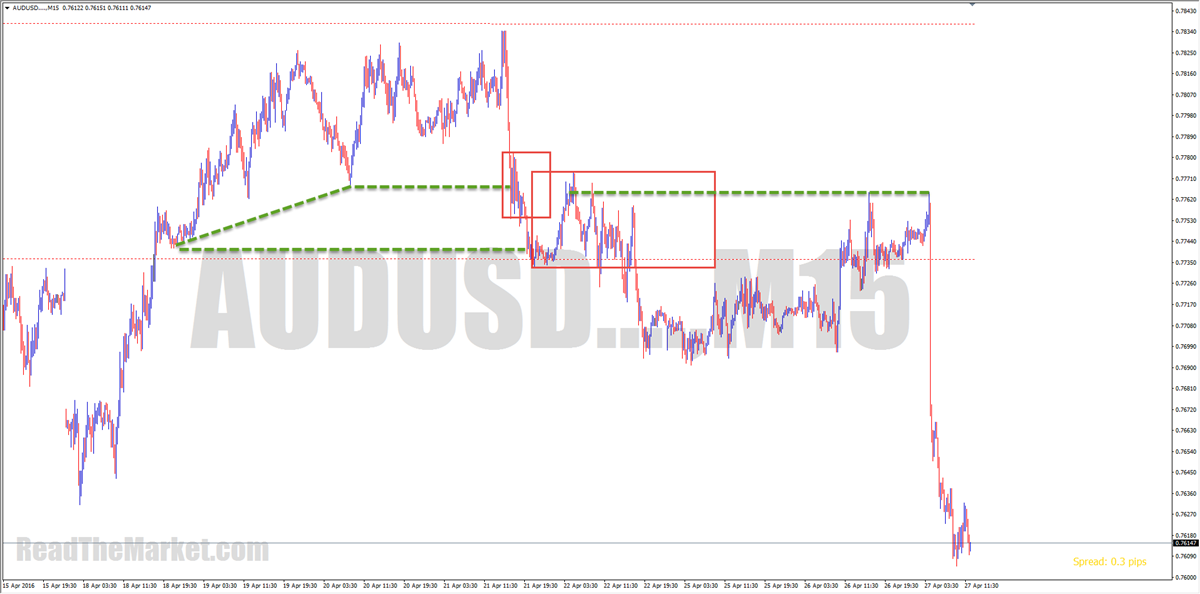
charlespips:
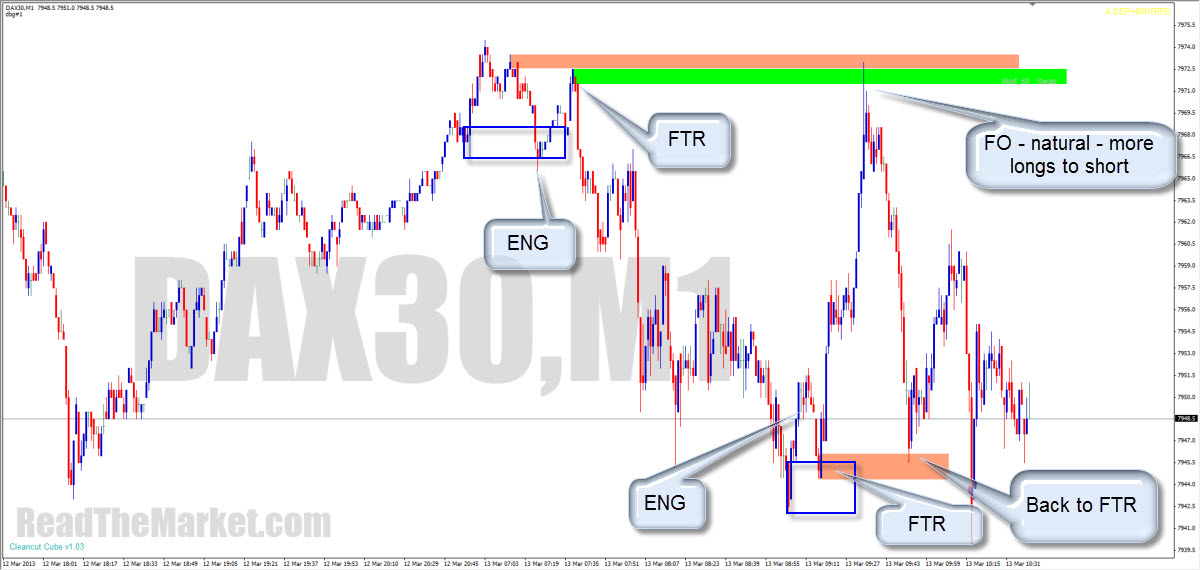
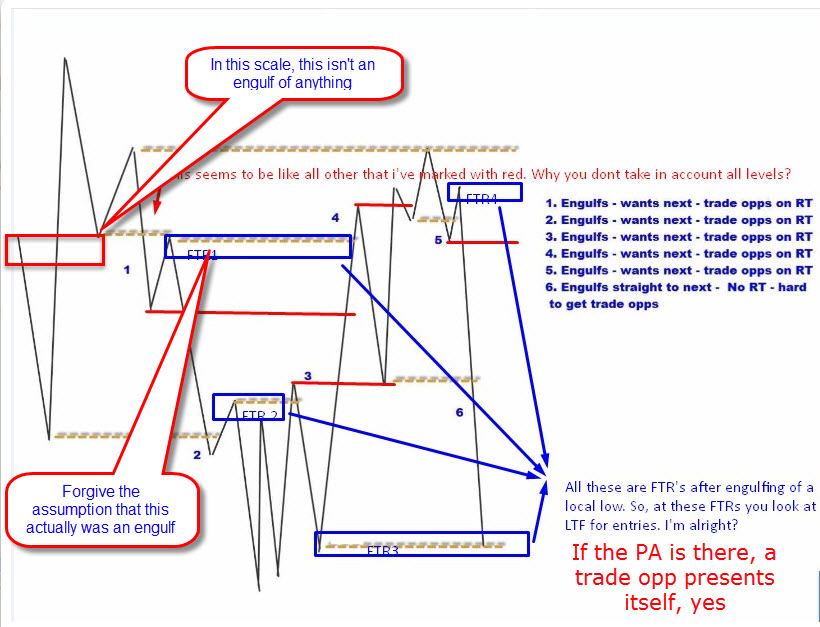
My thought is, If FTR formed after breaking key levels (not just recent low/high), this FTR become Important. Price would respect it first, before breaking it and aiming for the next important FTR above/below, or the origin.
As per Kovalenko's chart, you can see box1 is important because it break key SR level. Therefore, the last DP, which is the FL (red box 2) in an important one. When broken, the new FL/FTR (FTR 3) become significant as well.
As for why not XYZ, instead of FTR3 in your chart, the FL/FTR3 is a strong D zone that broke red box FL. the XYZ and B boxes you drew are CP zone if I'm not mistaken, as there is no clean D zone.
FTR 3 is (for me) exactly the edge of CPPAZ. If engulfed, it will slide through even further down past your XYZ zone (I haven't check the left), right to the source of the move/FTR down below. But no, price can't break the level because it's strong, and up she goes. I think it's also a FO because there is an engulf of the opposite FTR in box
https://readthemarket.com/index.php/en/forum/journals/1523-if?start=1050#40562
https://readthemarket.com/index.php/en/forum/journals/1523-if?start=1125#41730
https://readthemarket.com/index.php/en/forum/journals/1523-if?start=1250#43154
https://readthemarket.com/index.php/en/forum/journals/1523-if?start=1275#43501
https://readthemarket.com/index.php/en/forum/journals/1523-if?start=1300#43910
https://readthemarket.com/index.php/en/forum/journals/1523-if?start=1300#43916
https://readthemarket.com/index.php/en/forum/journals/1523-if?start=1300#43919

https://readthemarket.com/index.php/en/forum/journals/1523-if?start=1300#43928
https://readthemarket.com/index.php/en/forum/journals/1523-if?start=1300#43938
https://readthemarket.com/index.php/en/forum/journals/1523-if?start=1300#43951

https://readthemarket.com/index.php/en/forum/journals/1523-if?start=1350#44037

https://readthemarket.com/index.php/en/forum/journals/1523-if?start=1375#44136
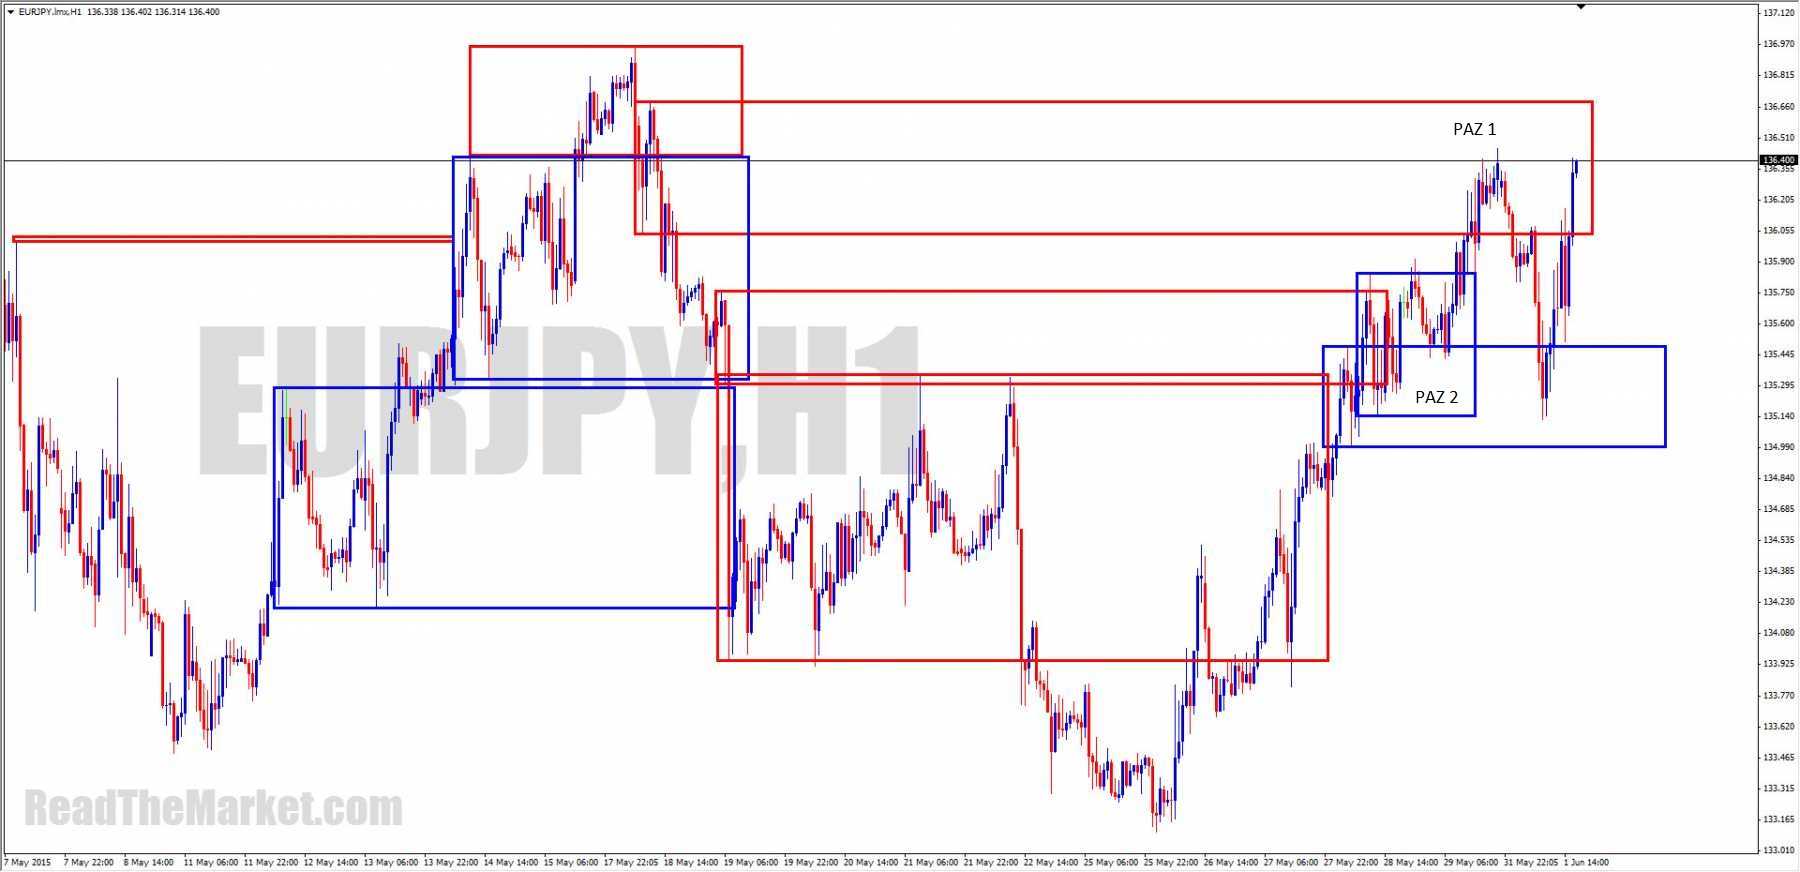
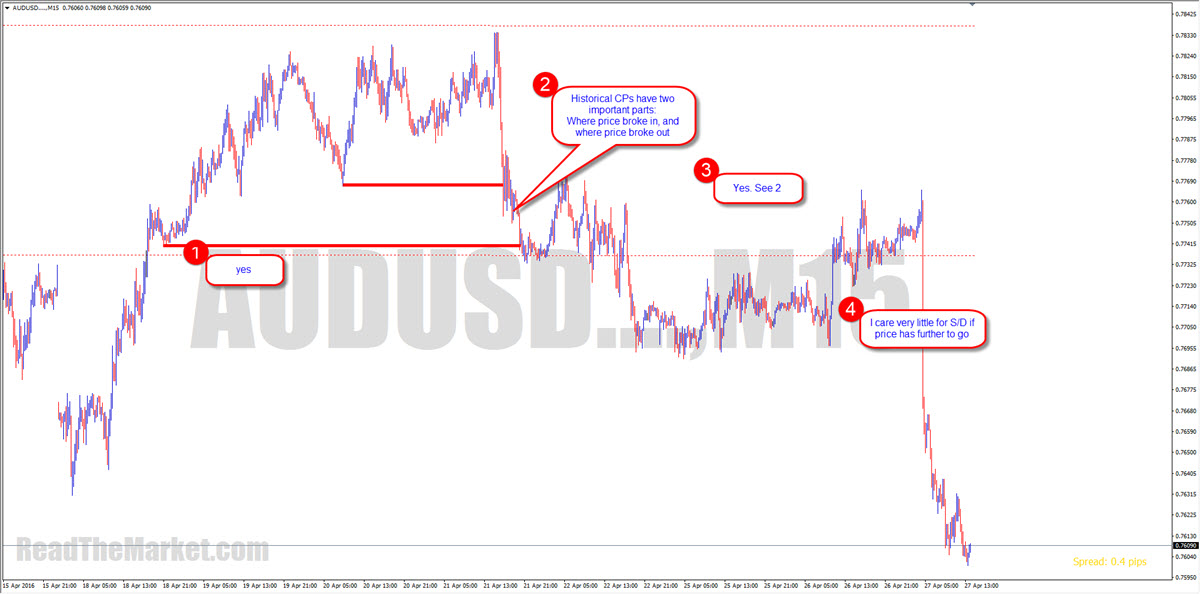
Hi IF,
I came across one of your screenshots which made my thoughts click. To reinforce this I would much appreciate it if you could answer one question, whenever you have the time.
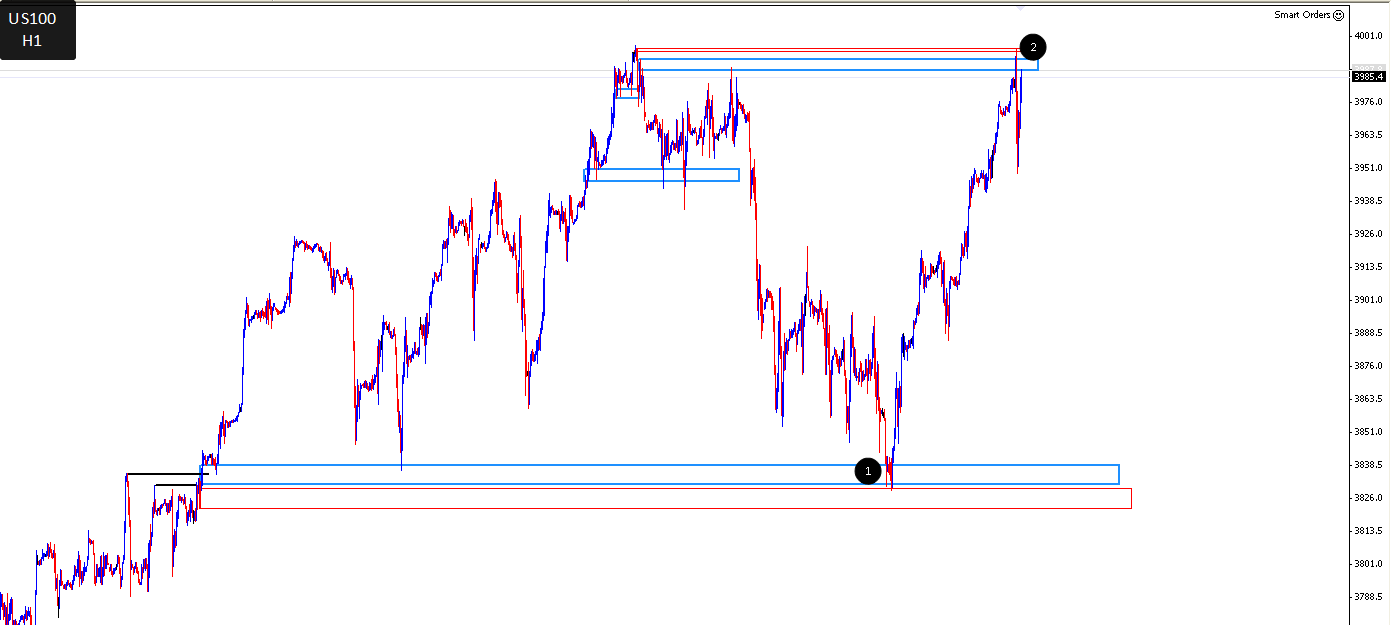
At current price in the screenshot, we do not know which direction price wants to go until either PAZ 1 or PAZ 2 is engulfed, therefore it is able to flag in-between them until then?
https://readthemarket.com/index.php/en/forum/journals/1523-if?start=1375#44273
(RDK) Hi Muffles, you make a very good point! Understanding this can give us a massive leap forward in our learning curve, especially when paired with a trained eye for spotting QM levels and important S/R. One thing I have noticed recently is the QM level flip, when a QM level fails it it actually turns in to a very well respected level on RT and even in the future, and If we check I guarantee it will have been in the past. The importance of how powerful S/R can been is shown in our QM levels, they even give a tradable bounce most of the time, like in your chart. Like you say, if the FO doesn't reach it's target then it's an engulf in to a new zone and we want the other side, this shows us what to expect from a QM level.
I am no expert but after many hours of looking at the charts I am seeing price for what it is, for me, there are levels of perceived value running through the charts in every TF, these levels move up and down but we can follow them with our flag limits and to be honest even just a good eye for perceived value flipping.
The more I look at the charts the more I think big money is lazy and that is why this is so simple, I imagine big money goes like this, 'If price is above X then it is worth Y, when it gets to Y I'll make a decision, If Y is to expensive it is worth X, If Y is still to cheap, it is worth Z but no less than X'. And because big money is so lazy, these perceived levels of value are pretty evenly spaced, probably to the pip if we really wanted to take the time to find out.
I would like to take this opportunity to apologise to you IF and to be honest the rest of the teachers and authors of the training material, I'm not stubborn enough to not admit when I'm wrong, I went through a period of mental turmoil, which I'm sure many of the members here have at some point in trying to master this. The frustration was more with myself and I didn't really have anywhere to direct it when I hit a wall, taking time away actually really helped me, I had to visualize the charts in my head but I couldn't see the detail, this was the biggest aha moment of them all and I was no where near a screen.
Anyway, I'm apologising for doubting what you have supplied here, I would also like to give my admiration for how you have stuck with this even through all of the grief you must receive from people. I don't really know you but I do respect the fact you give so much, expecting very little, if nothing in return.
I hope you manage to read this, along with every other member who may have doubt. Trust what you see, I saw levels of perceived value and over layed the FTR, FL, diamond and QM on top of them, they all form on perceived levels of value, this is how we can get out of a failed trade at BE or better, by only trading these levels, I'm not saying it is easy but it works.
Thank you all for your time. I'll be getting back to my journal this week with a calm approach and self control.
https://readthemarket.com/index.php/en/forum/journals/1523-if?start=1375#44317
https://readthemarket.com/index.php/en/forum/journals/1523-if?start=1400#44455
https://readthemarket.com/index.php/en/forum/journals/1523-if?start=1425#44461
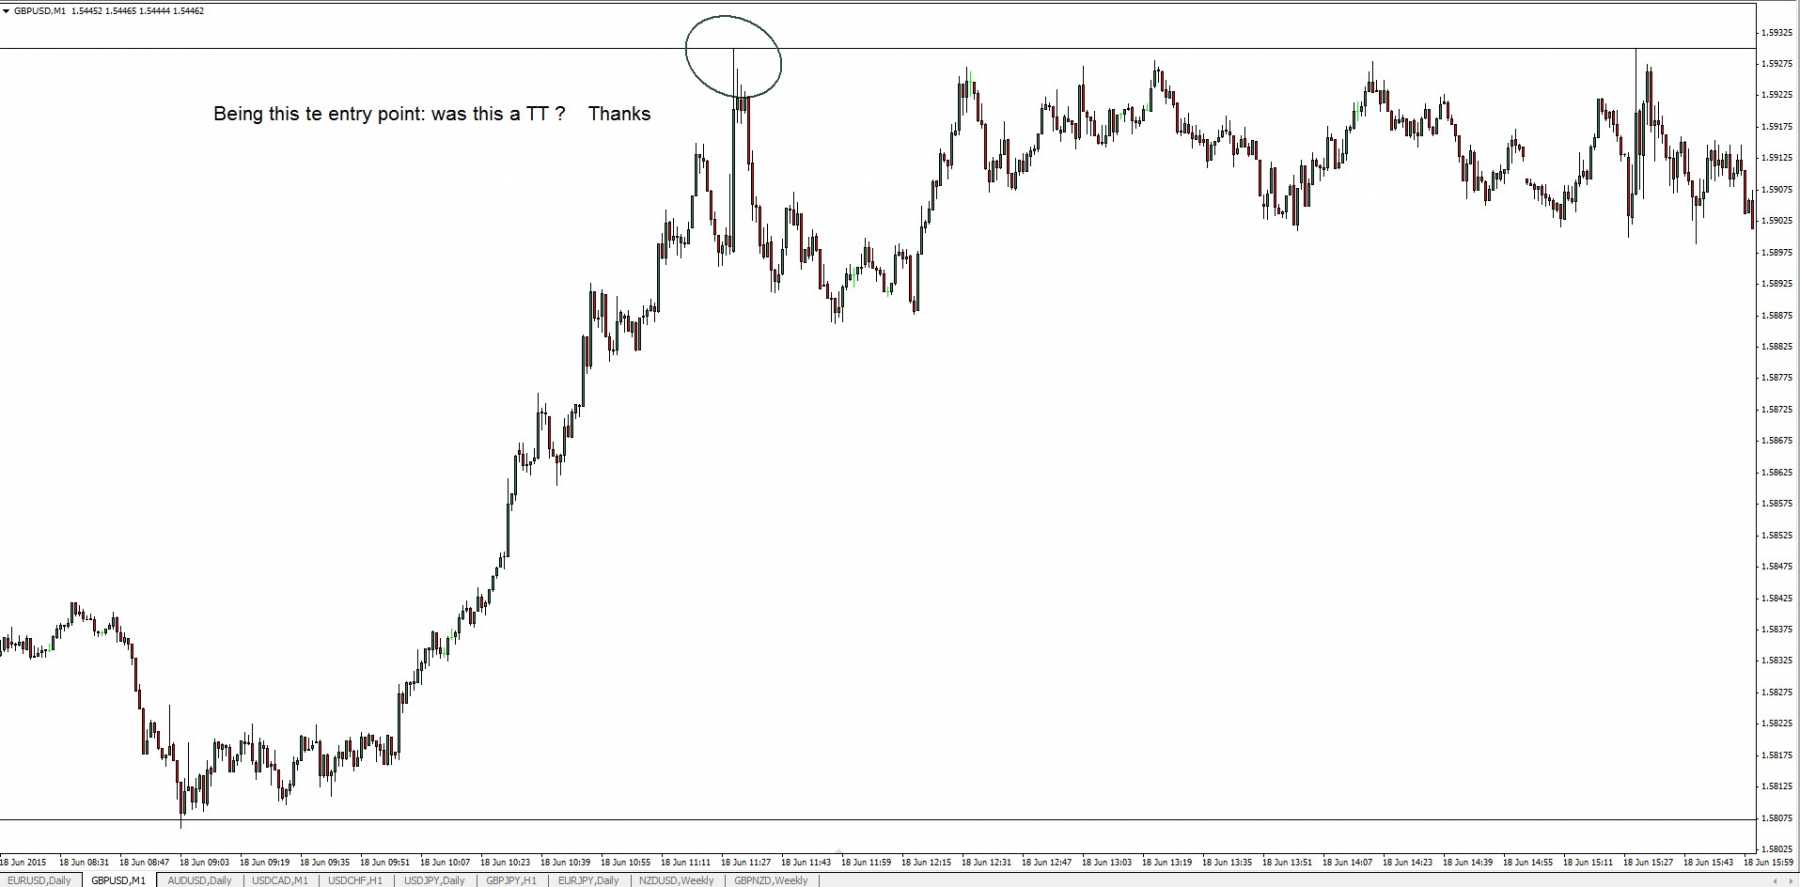
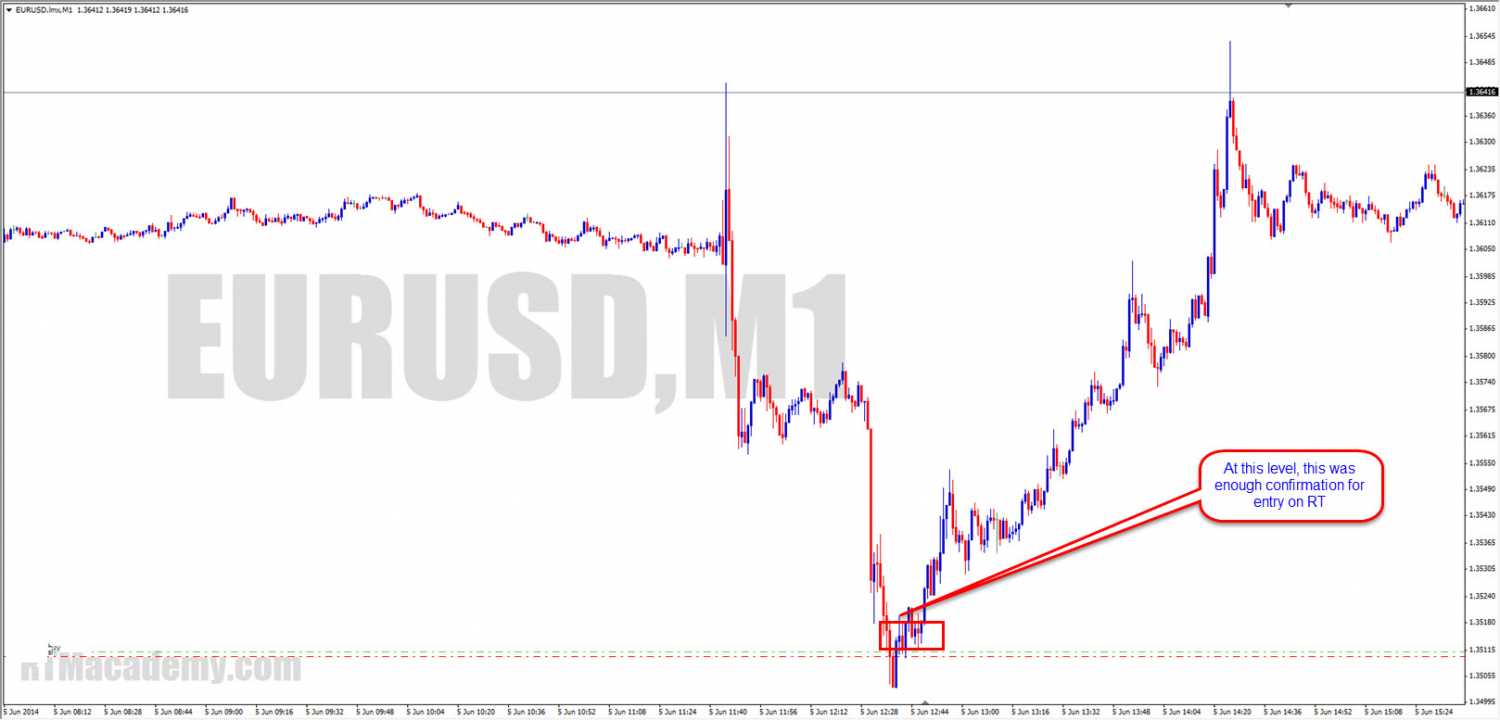
often wonder about that myself
Yes, it was a TT. The approaching PA was enough to enter. The reaction PA was enough to hold it
https://readthemarket.com/index.php/en/forum/journals/1523-if?start=1425#44484
Whenever
I do take losses from time to time. Granted, I've traded so little since I began again that I haven't had any losses yet!
I'm extremely careful with entries, making sure that should my level break, my entry point is where price will quickly retrace to before advancing or making a deep retrace.
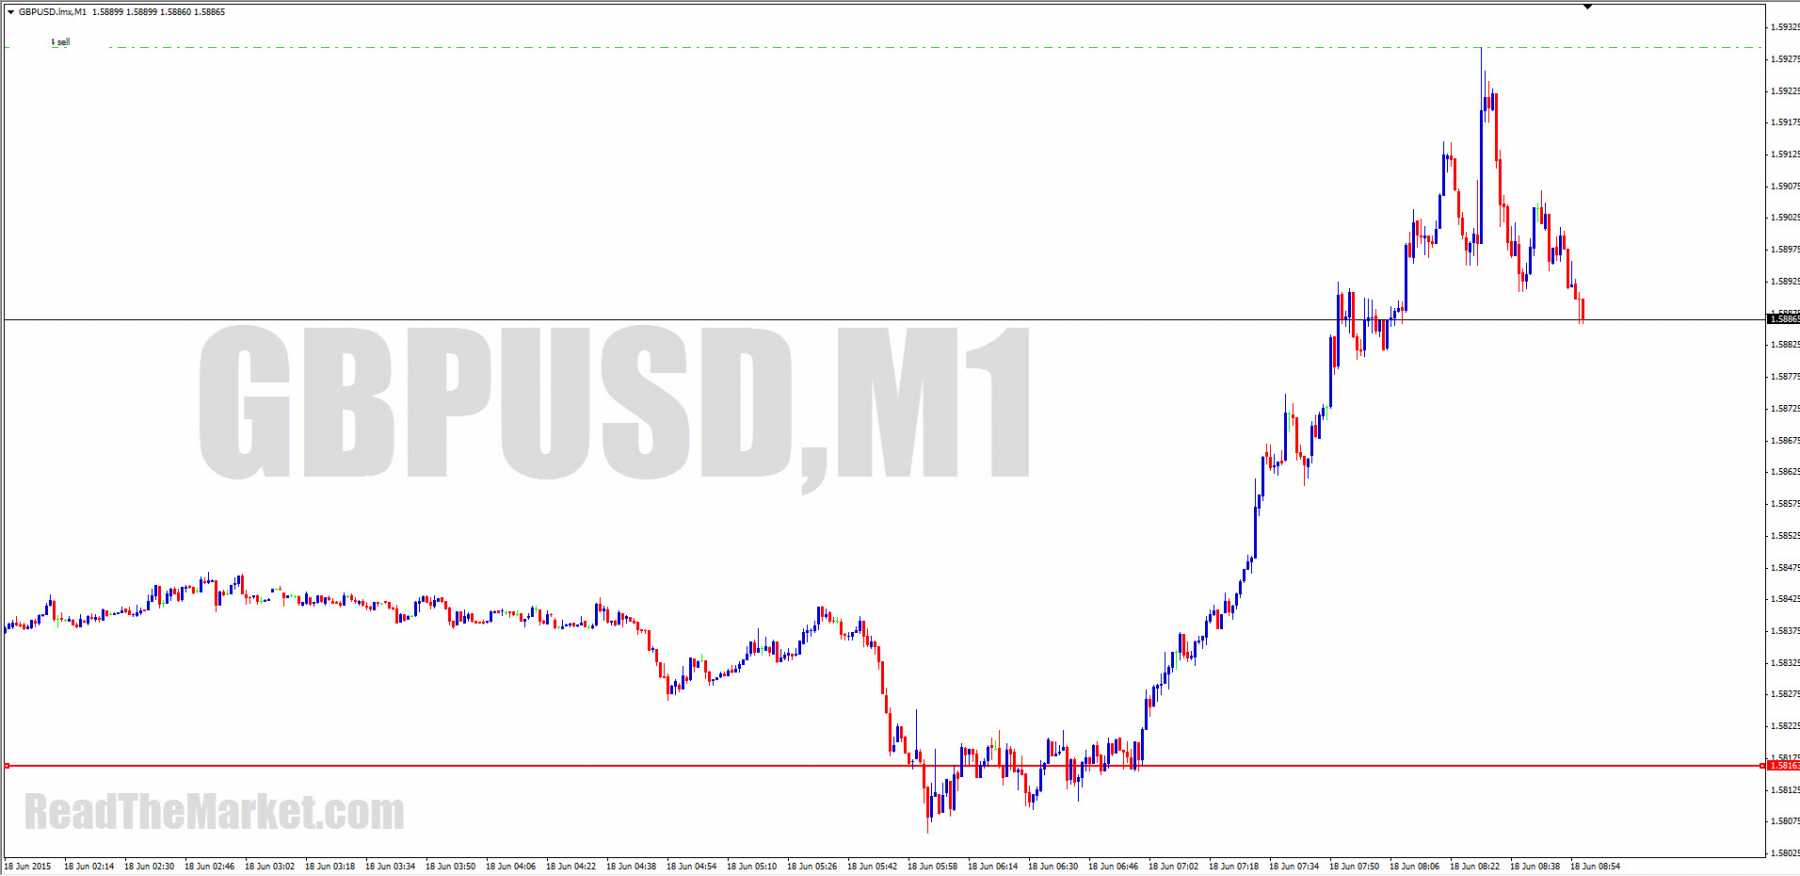
Tink
I'll usually take something off to make sure I can't lose.
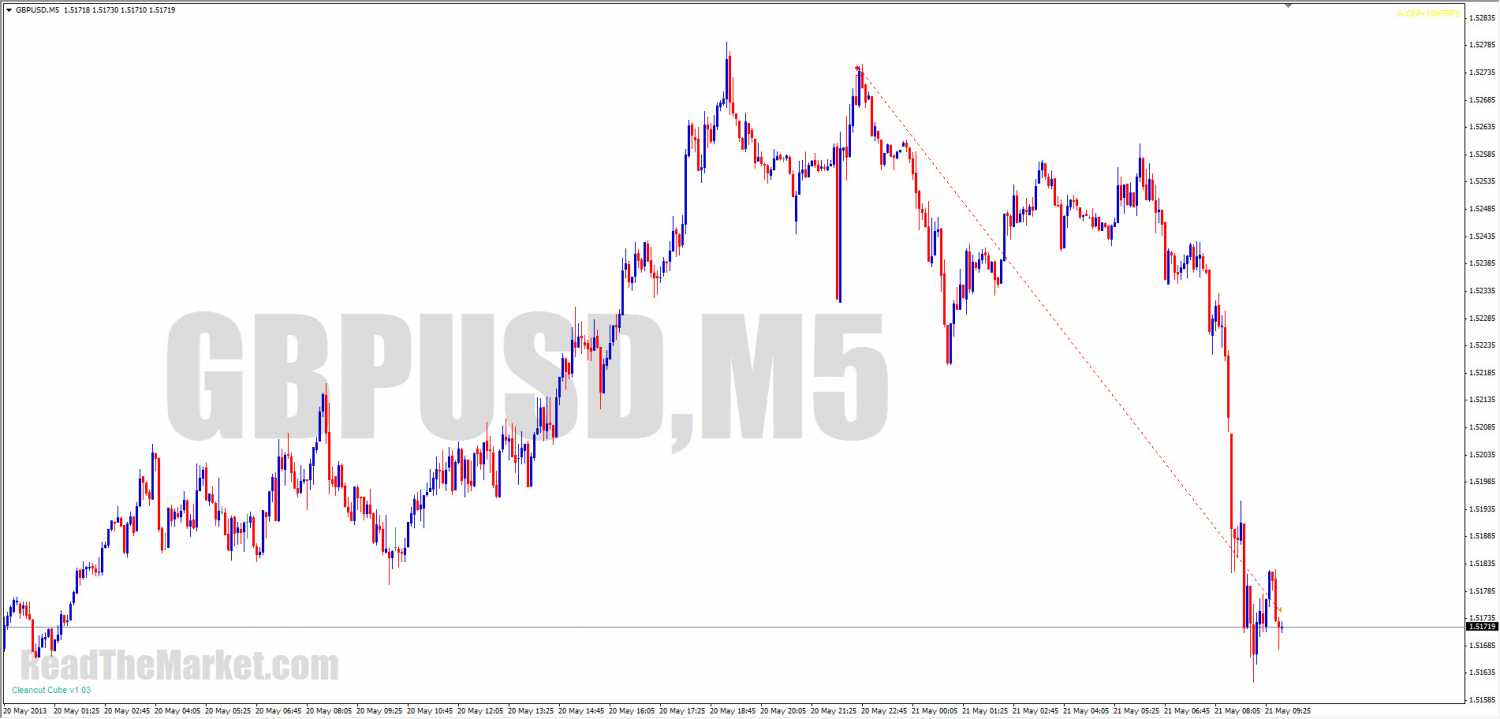
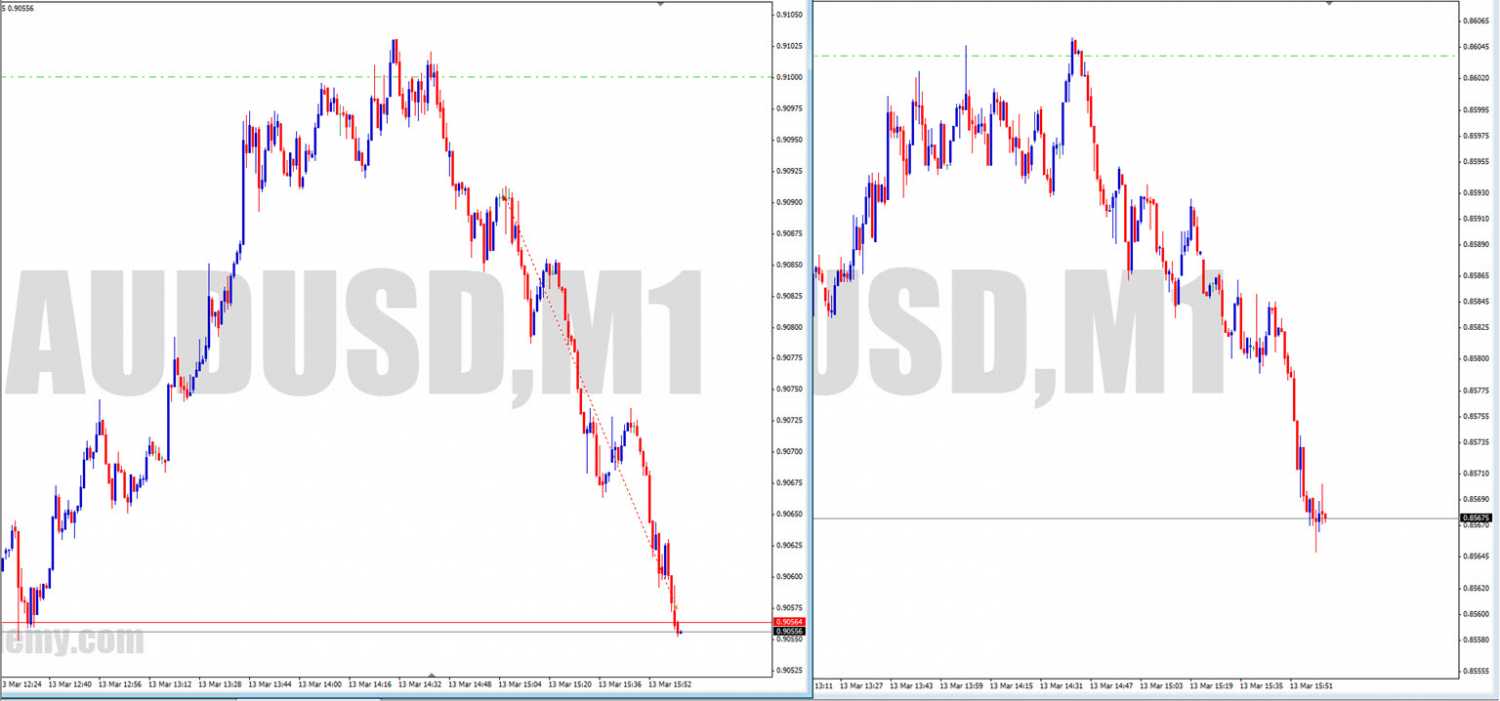
On that GU, if I recall correctly, I took off one quarter at the red line at the bottom of the chart
https://readthemarket.com/index.php/en/forum/journals/1523-if?start=1425#44494
https://readthemarket.com/index.php/en/forum/journals/1523-if?start=1425#44533

https://readthemarket.com/index.php/en/forum/journals/1523-if?start=1450#44547
https://readthemarket.com/index.php/en/forum/journals/1523-if?start=1600#45718
https://readthemarket.com/index.php/en/forum/journals/1523-if?start=1600#45725
https://readthemarket.com/index.php/en/forum/journals/1523-if?start=1650#46138
(bobv)
https://readthemarket.com/index.php/en/forum/journals/1523-if?start=1675#46316
https://readthemarket.com/index.php/en/forum/journals/1523-if?start=1675#46338
https://readthemarket.com/index.php/en/forum/journals/1523-if?start=1700#46557
https://readthemarket.com/index.php/en/forum/journals/1523-if?start=1700#46590
https://readthemarket.com/index.php/en/forum/journals/1523-if?start=1775#48578
(Muffles)
https://readthemarket.com/index.php/en/forum/journals/1523-if?start=1800#48950
If the low and the lower low are reactions to the same flag limit, it can't strictly be called a Quasimodo.
It may work out, but without the prior PA, there can be no guarantee
https://readthemarket.com/index.php/en/forum/journals/1523-if?start=1800#48967
https://readthemarket.com/index.php/en/forum/journals/1523-if?start=1800#48972
(Muffles)
I've finally narrowed down my trading to if X then Y, massive thanks to you.
Just wondering when you did trade (or if your back at it) what you personally did to enter on a retrace; would you wait for PA again to signal the retrace has ended or would you just touch trade when the retrace reached a FTR with unfilled orders?
(IF) When we have an If/Then setup, we don't need PA for a RT entry. We simply need to decide whether or not to wait for the very best price on RT.
If it hits straight away, we have the very best possible R. If not, we may miss decent decent swings within the forming flag while we wait.
https://readthemarket.com/index.php/en/forum/journals/1523-if?start=1800#49050
A bit of simple advice, to avoid overtrading and impulse trading:
Draw up the most important looking zones, and look for trades only there.
https://readthemarket.com/index.php/en/forum/journals/1523-if?start=1800#49064
Don't simply look left once.
We can't read the story of price that way.
We must look left, then left again, and often again and again, in order to find what's important
https://readthemarket.com/index.php/en/forum/journals/1523-if?start=1800#49096
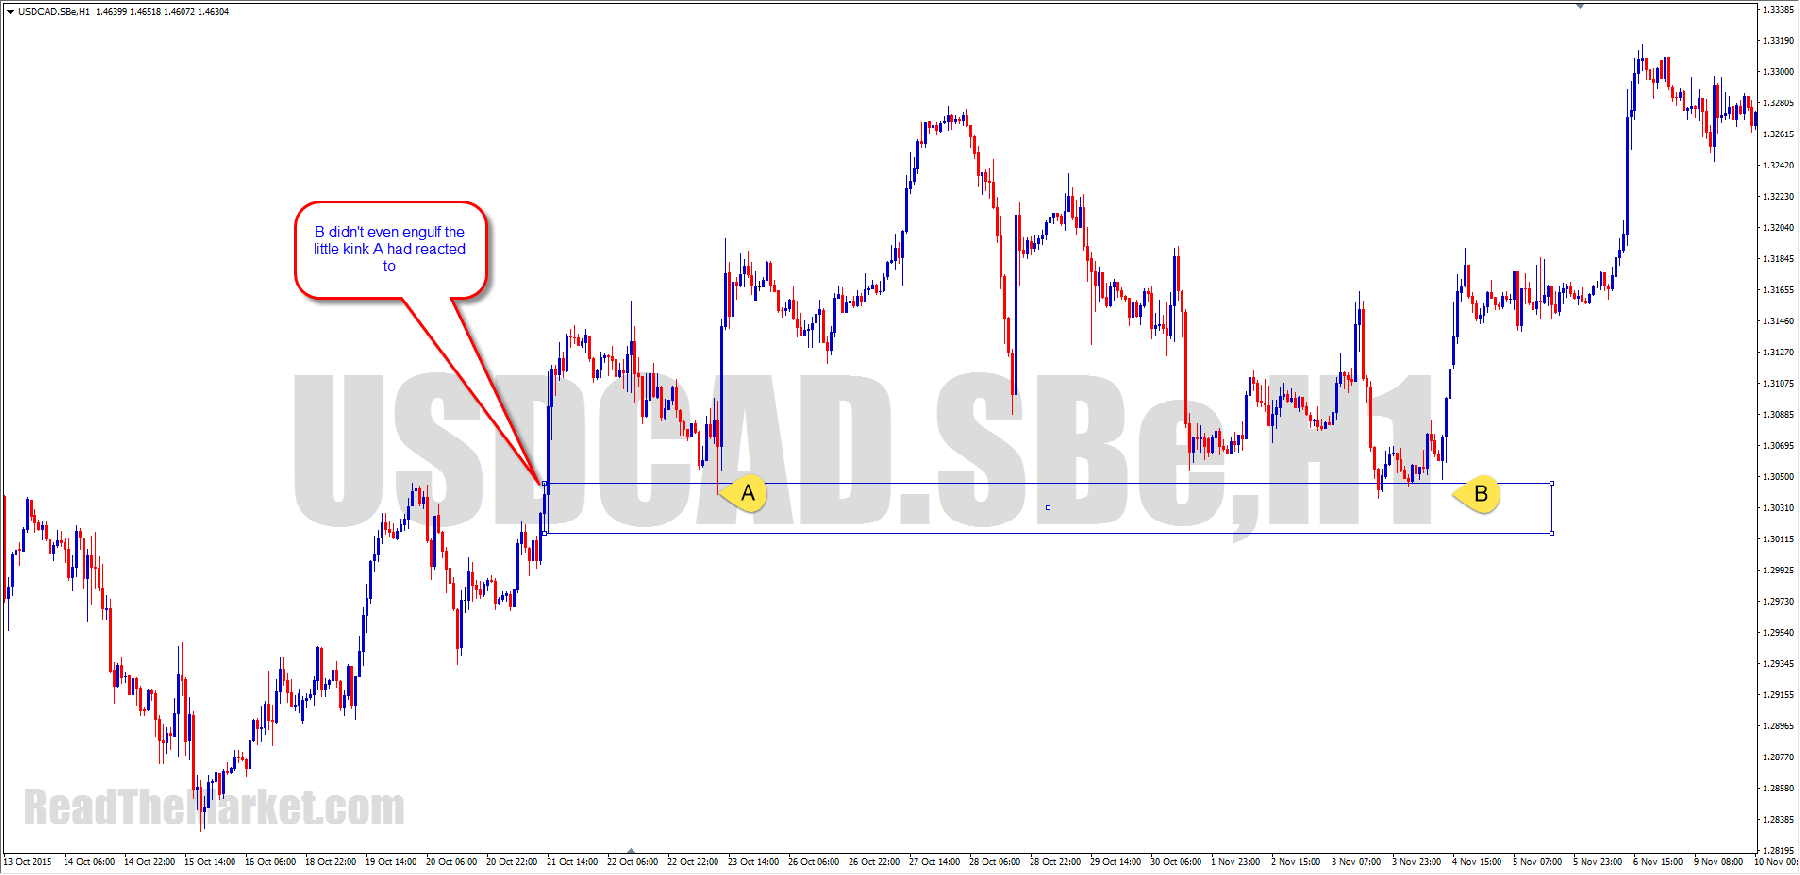
Remember, if we don't zoom out, we don't get to see the full picture of price. We don't get to see the significance of tiny kinks which seem insignificant in our zoomed in view
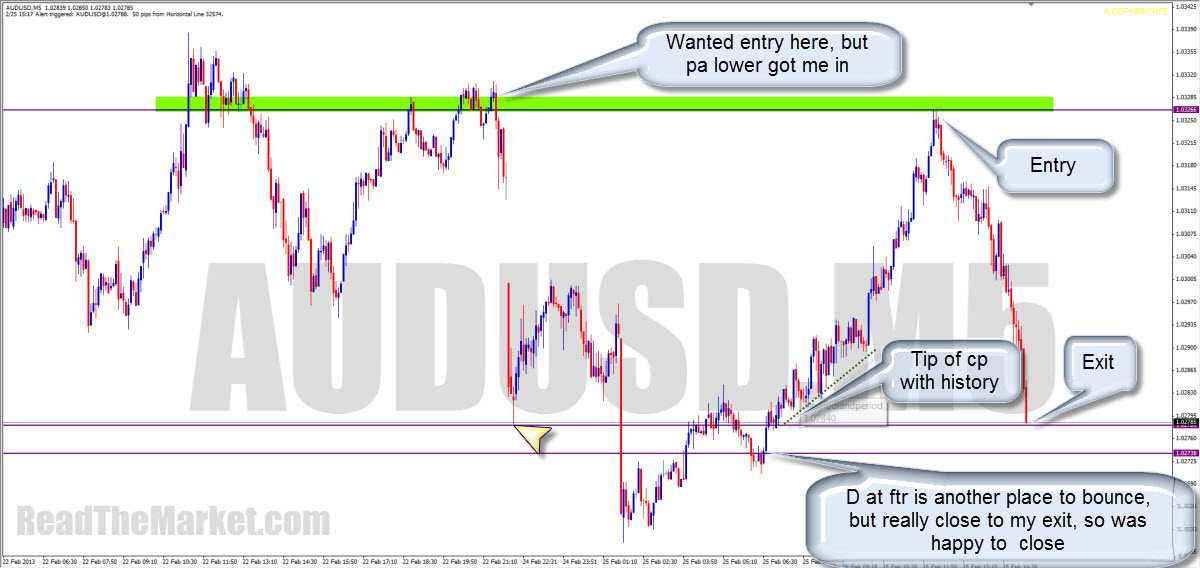
https://readthemarket.com/index.php/en/forum/journals/1523-if?start=1825#49840
Looks like your entry reason is well explained. If you go to Daily at that price, you'll see extra reason to take the trade.
The exit was simple. There were stops to be had at the MPL of the CP
https://readthemarket.com/index.php/en/forum/journals/1523-if?start=1850#50791
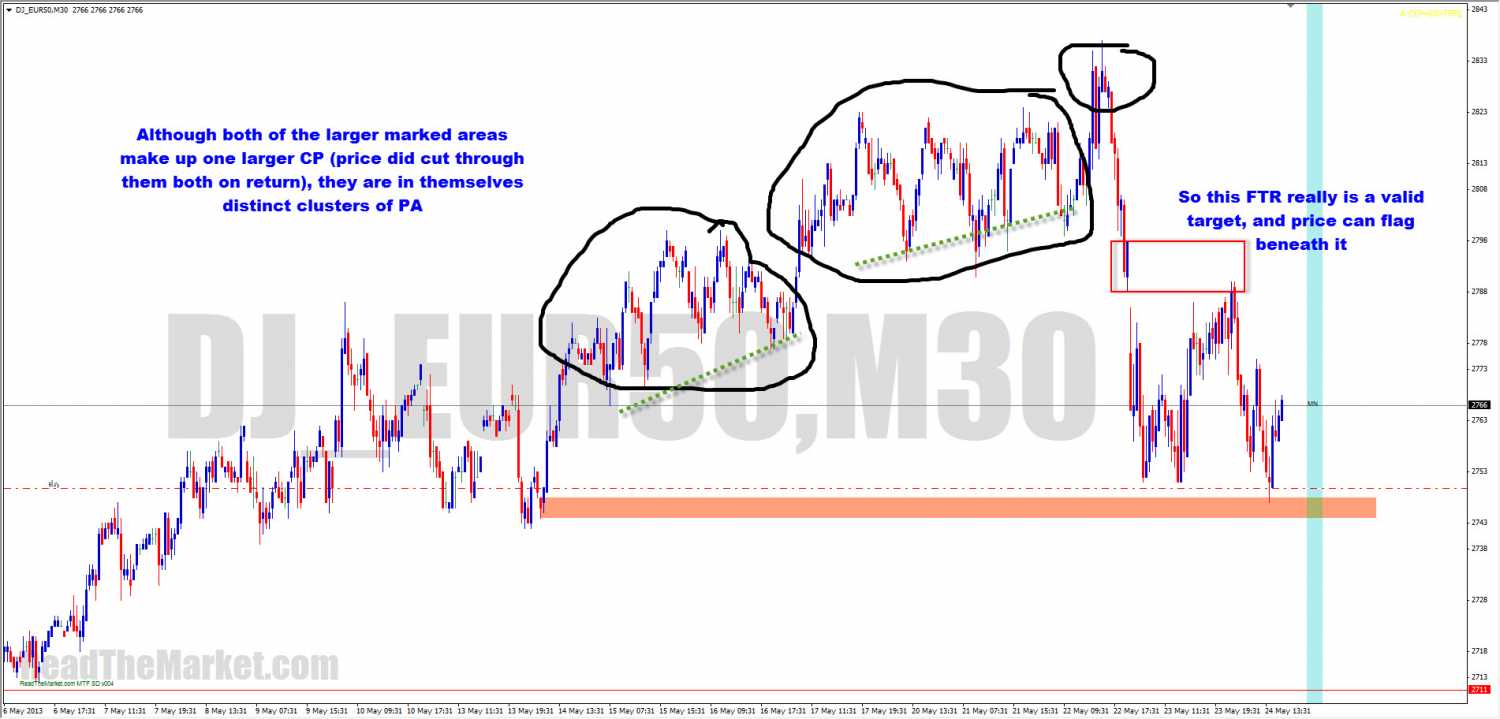
You've drawn one big cp there, instead of the two which are really there.
It's no setup at all
https://readthemarket.com/index.php/en/forum/journals/1523-if?start=1850#50804
https://readthemarket.com/index.php/en/forum/journals/1523-if?start=1875#50888
Taking this image in isolation may leave out other important information, but since it's all we've got:
https://readthemarket.com/index.php/en/forum/journals/1523-if?start=1900#51041
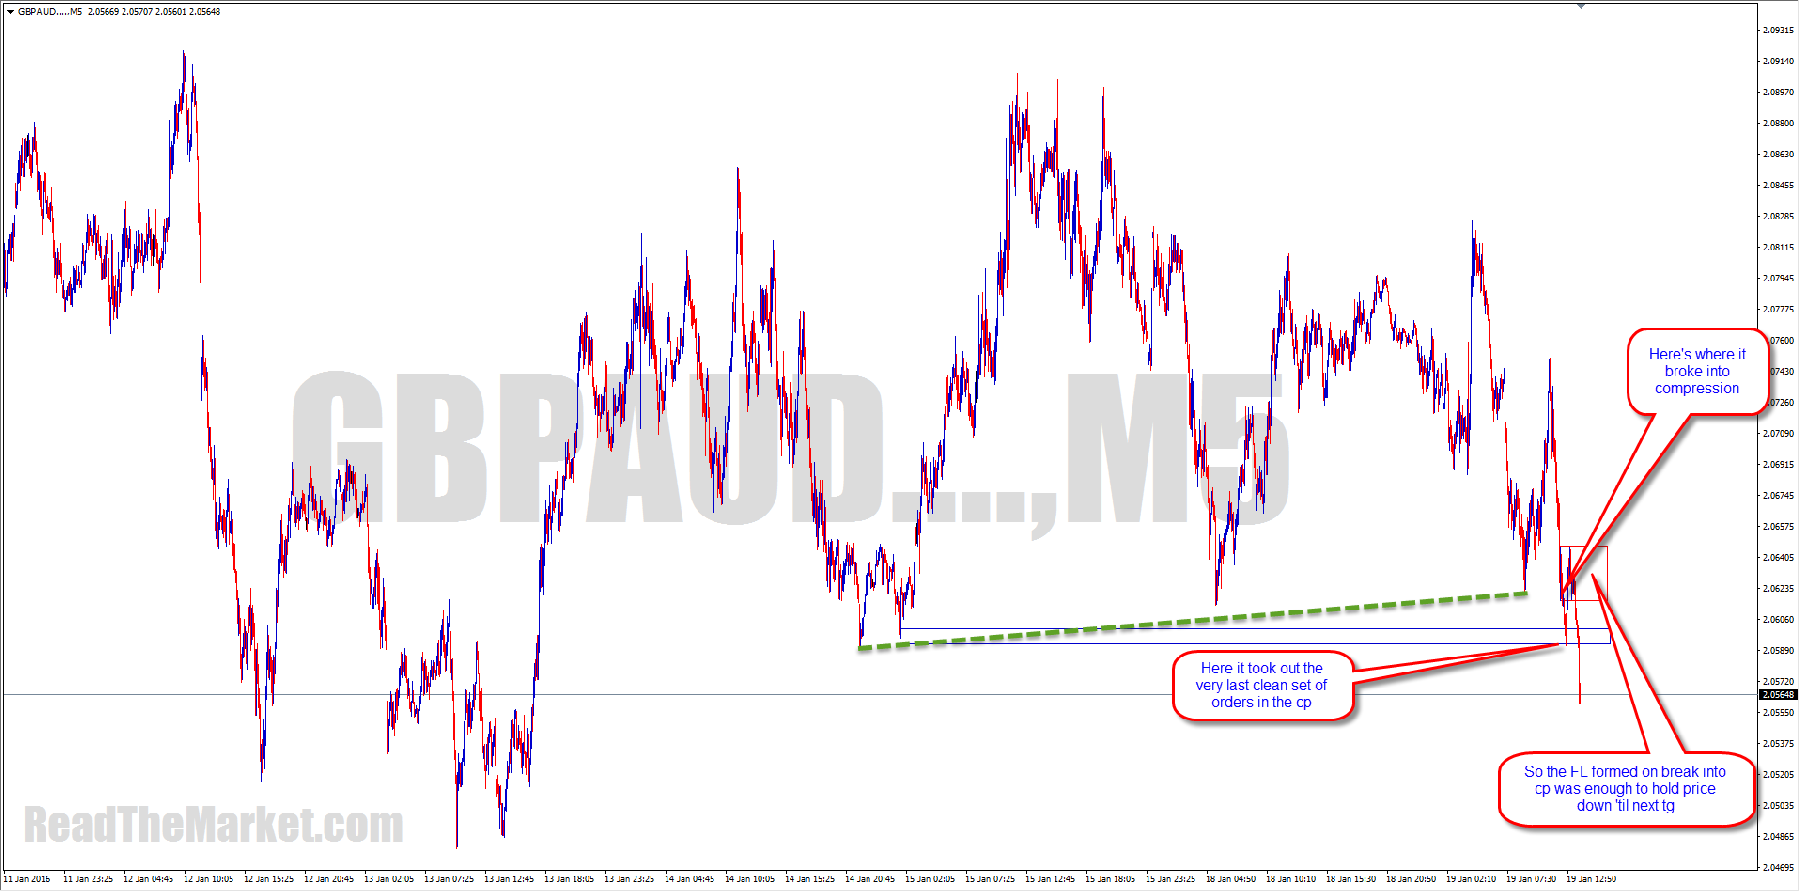
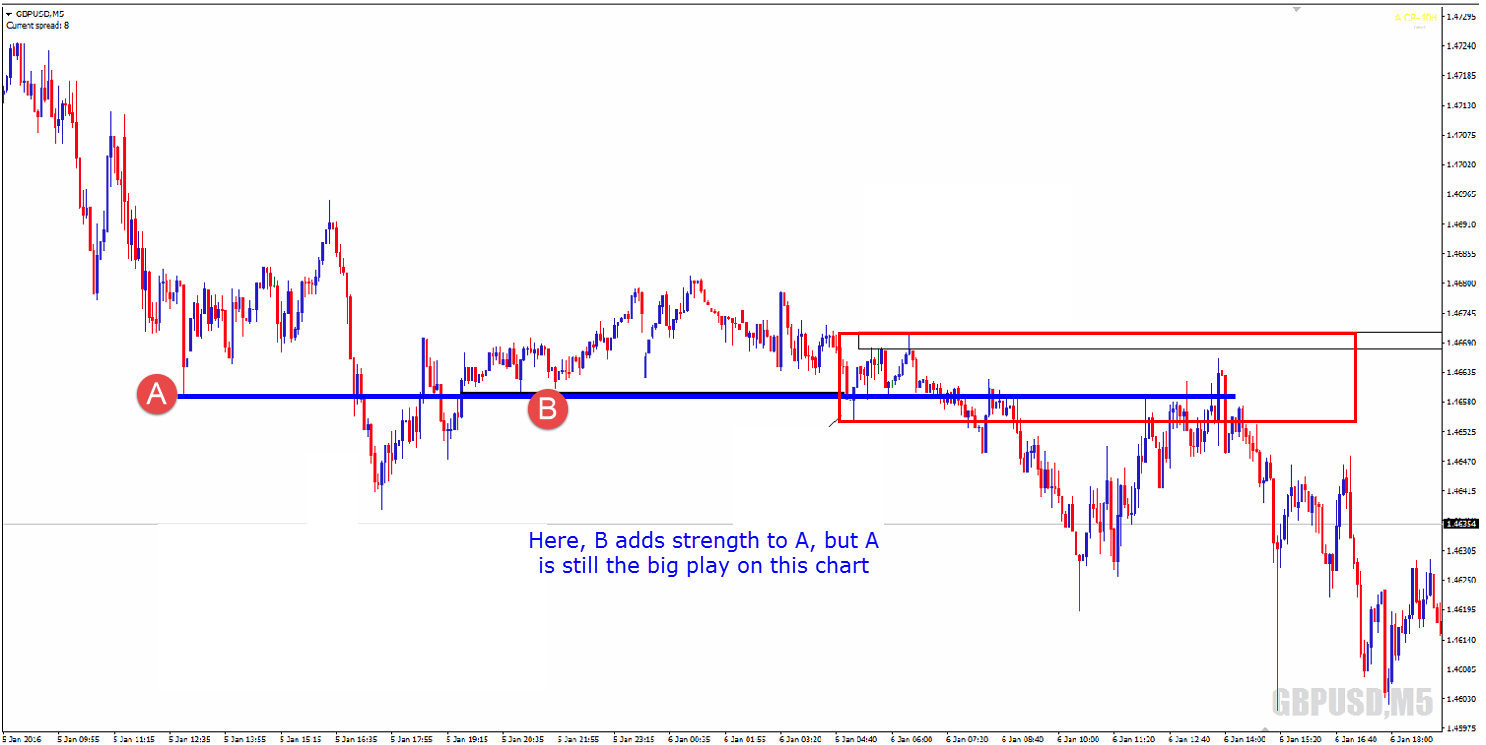
Compression is a very handy tool
Can you answer your questions by looking at the compression below?
https://readthemarket.com/index.php/en/forum/journals/1523-if?start=2025#52100
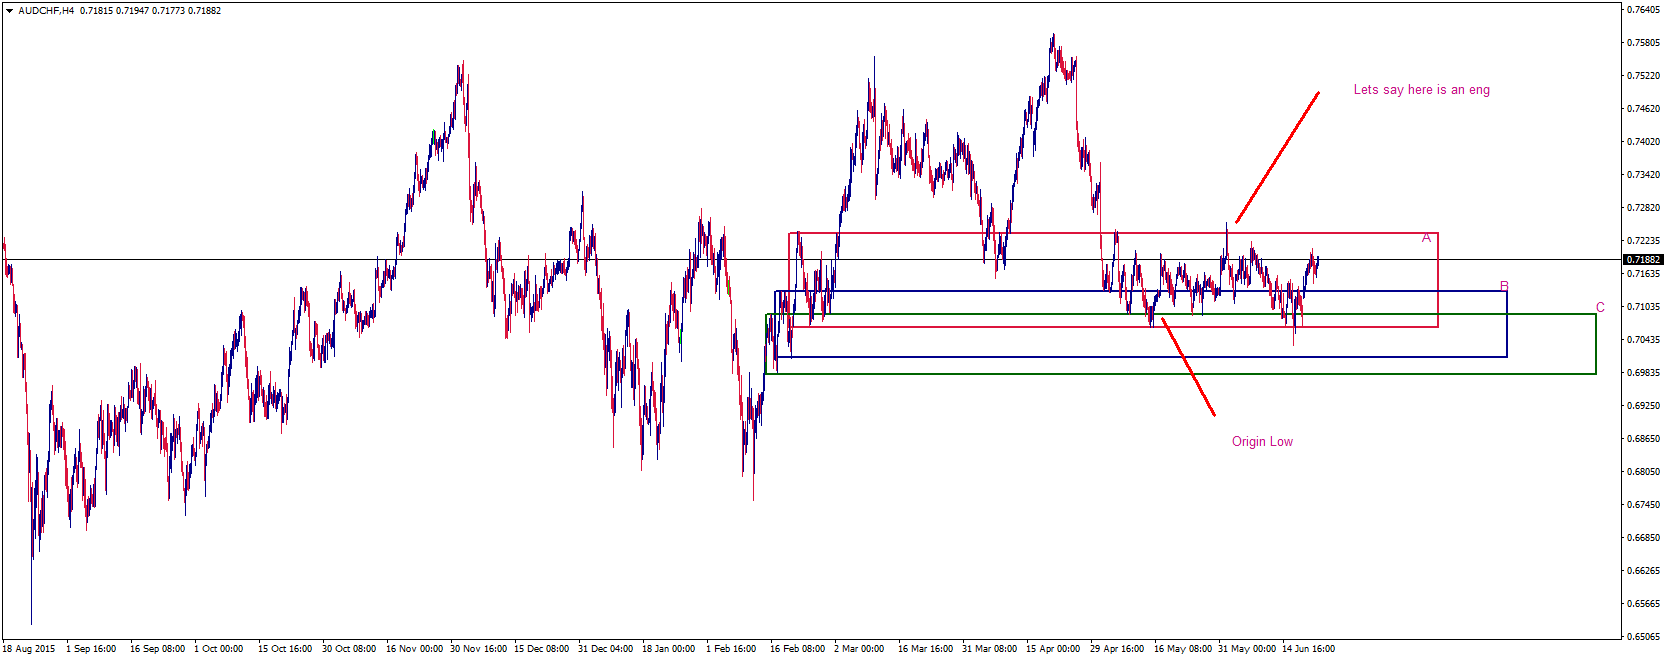
Taking the entire chart into consideration, the important one of those three boxes is C
https://readthemarket.com/index.php/en/forum/journals/1523-if?start=2050#52217
I couldn't write any of it without giving away what the PAZ is!
Having said that, what I've written is a way to use the reaction to any FTR to be able to take very simple trades with clearly defined entry, stop and target.
To fully explain the PAZ takes an awful lot of teaching, and can be an information overload.
Let's say that there's money to be made from solving quadratic equations, and also from advanced calculus.
The Academy Lite will teach you the former, while the Academy teaches the latter.
Profiting from the market can be rule based and very simple: Academy Lite
A complete understanding of the market takes far more dedication: RTM Academy
https://readthemarket.com/index.php/en/forum/journals/1523-if?start=2175#52888
https://readthemarket.com/index.php/en/forum/journals/1523-if?start=2175#53014
https://readthemarket.com/index.php/en/forum/journals/1523-if?start=2275#58543
If we want to see, we use our eyes
https://readthemarket.com/index.php/en/forum/journals/1523-if?start=2275#58545
https://readthemarket.com/index.php/en/forum/journals/1523-if?start=2425#61531
With all the chats I'm in, I have lots of catching up to do, and I don't remember in which chat I said what!
I'm glad there's a lot of discussion in here, as I know where my journal is!
I want to answer a question I get asked a lot:
"In which timeframe do you trade?"
There's no need to trade timeframes.
Just trade high R instead, which could be on any scale.
If price is at a nice weekly SR kink, which is only a few pips wide, or it's at the MPL of a larger kink, await M1 PA.
If there's space in that TF to get >1R to the M1 approach kink, then take the trade, closing enough at tg1 to cover your stop, then allow price to either hit the weekly approach kink (watch PA there to see if you should close all or allow to run) or your stop.
That's absolutely risk free trading!
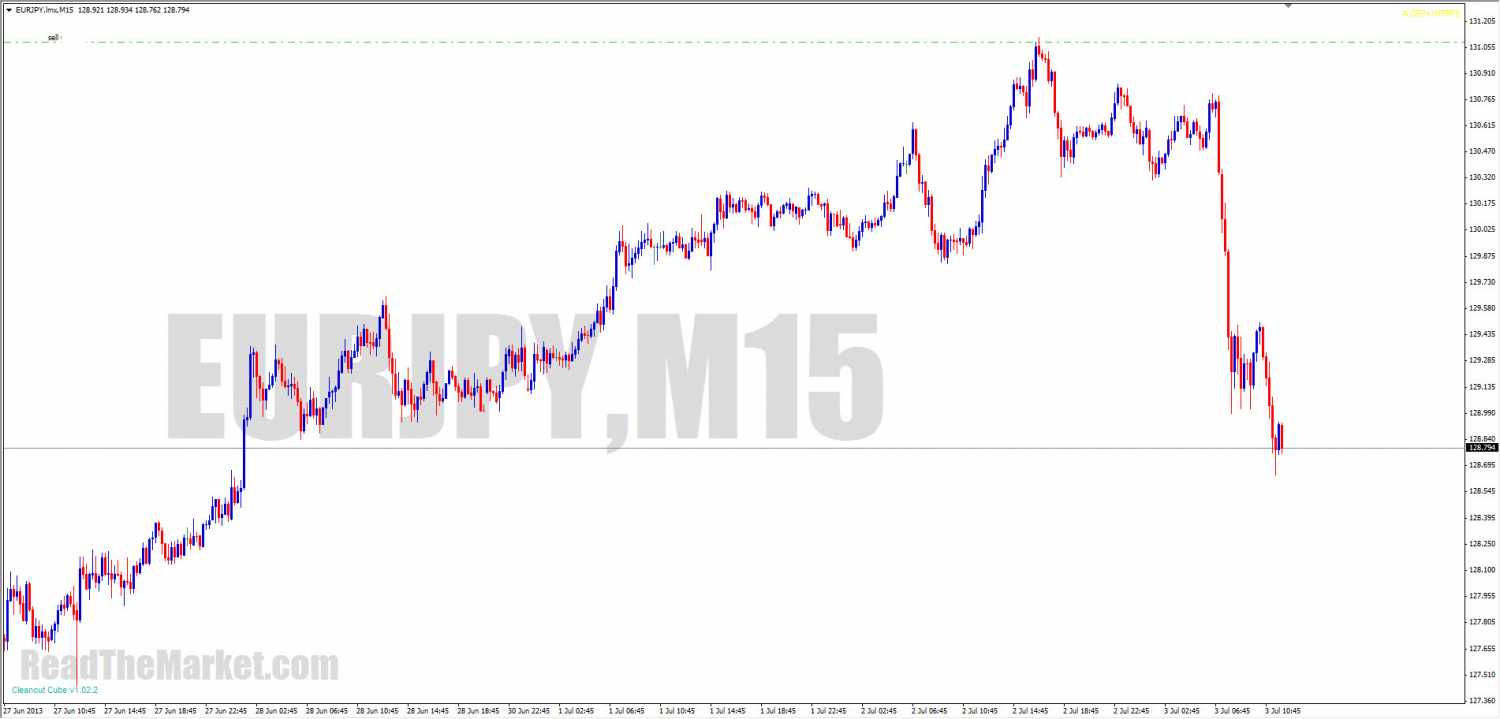
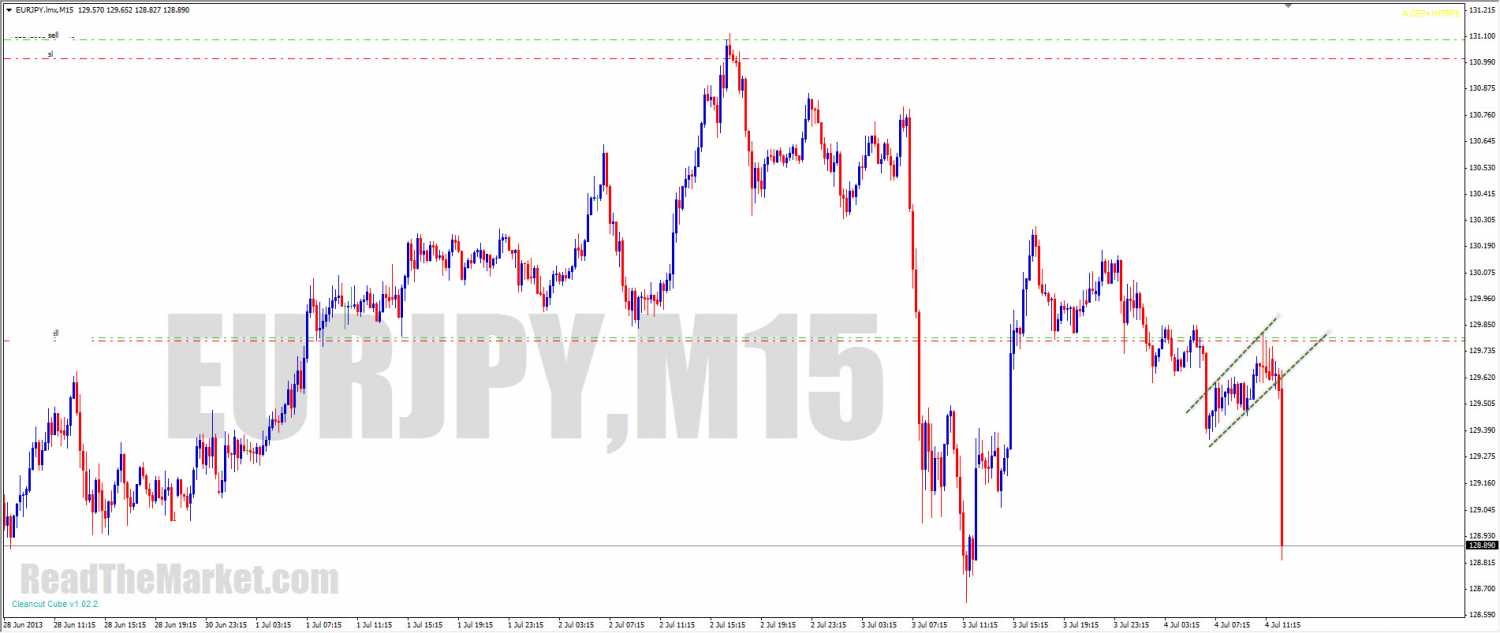
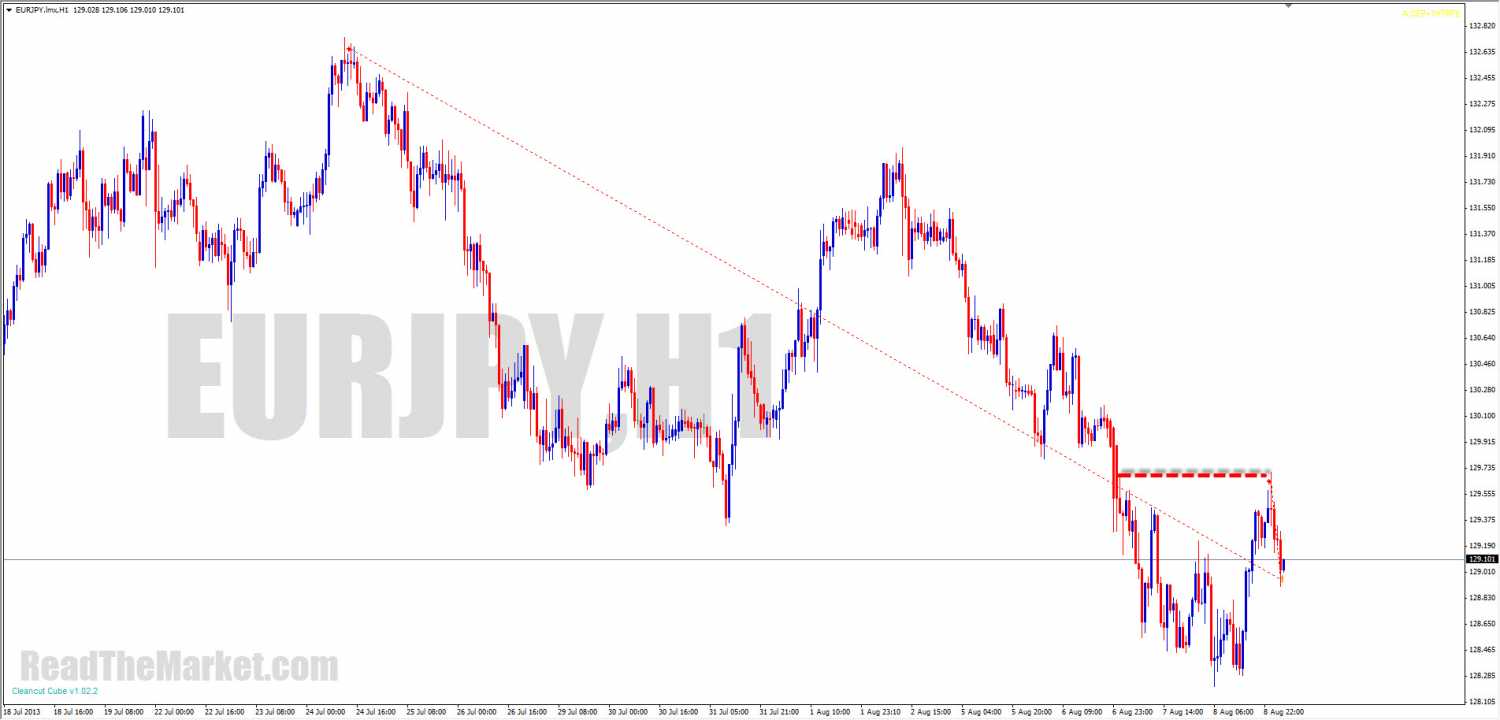
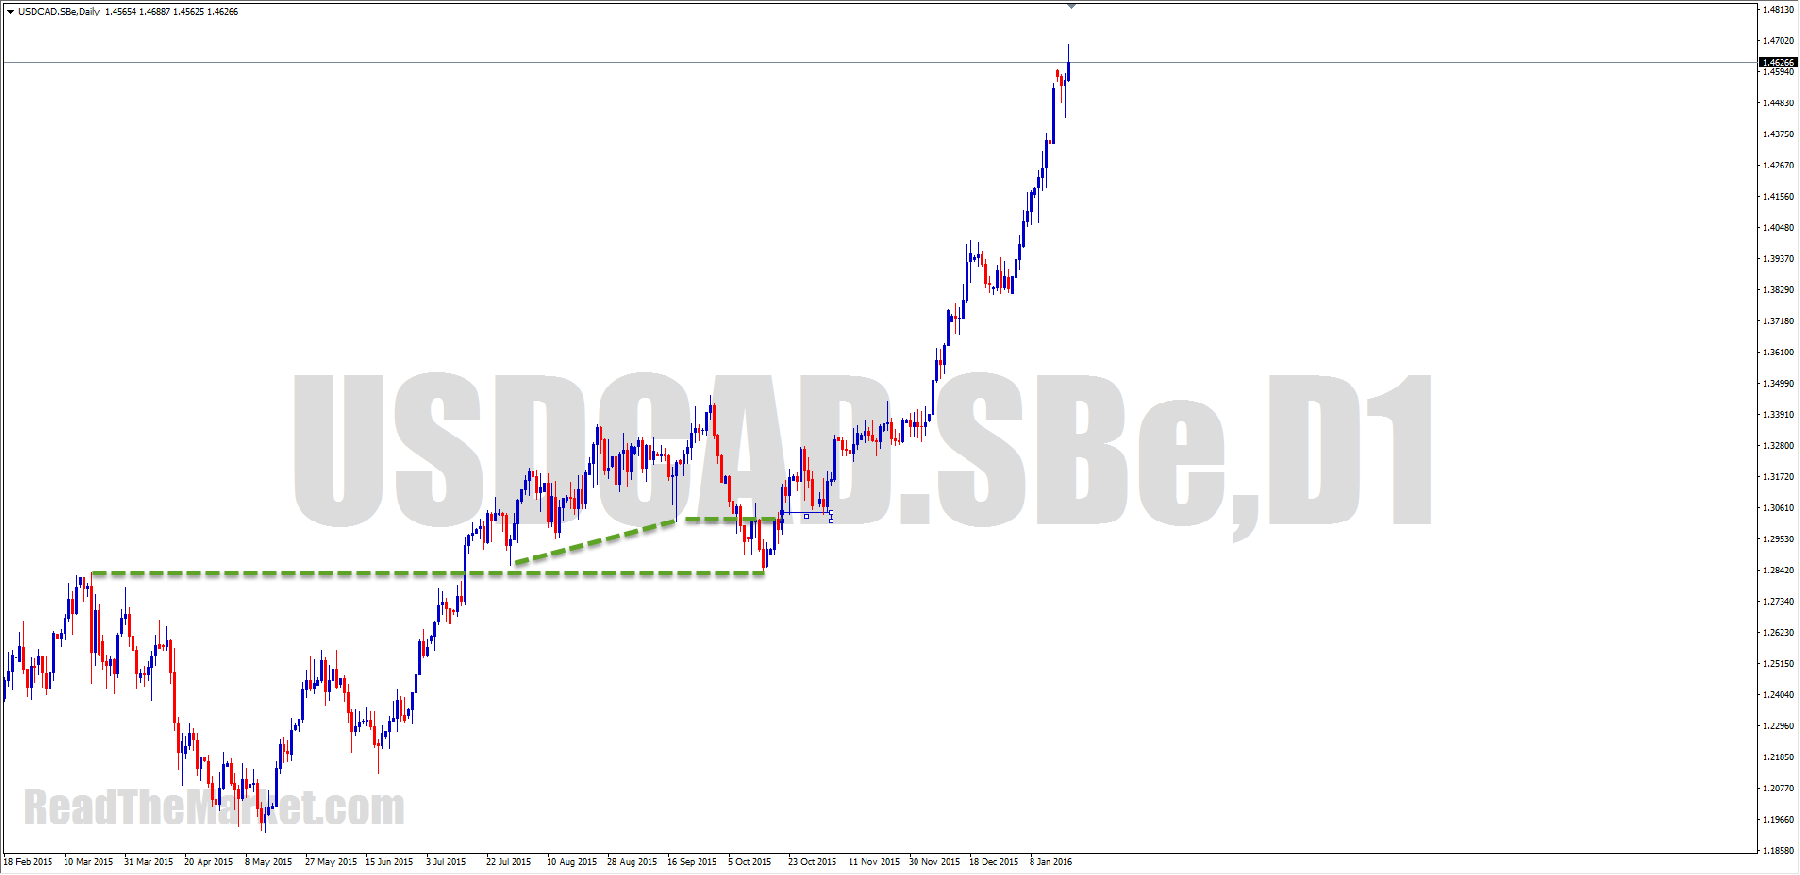
POLE & FLAG
Pole
start at a break of a range (FTR that breaks a range / BREAK-OUT FTR) and ends
at the next opposing FL.
When the next FL break, a new Pole starts and this is the point where Target is. Target = Pole Base
A pole UP starts at the bottom of ANOTHER FLAG (broken into), or
A pole UP starts at the breakout top of its OWN FLAG (broken out of);
or
A pole down starts at the top of ANOTHER FLAG (broken into)
A pole down starts at the breakout bottom of its OWN FLAG (broken out of).
Go through History, find out FLAG and POLE analysis on everything.
where highs (or lows) got broken, and then, in the same direction see where those highs (or lows) on the next ones got broken; then draw FTRs rectangles. between rectangles = PAZ. inside FTR rectangles there are also PAZ but in smaller scale.
Inside rectangles, we can draw FLAG and POLE. Remember POLE starts after a BREAK.
Inside a POLE, we will find lower scale FLAGS and POLES.
If you're at HTF demand, await an engulf north
of an important supply - this is the signal that price wants to get into the
higher zone
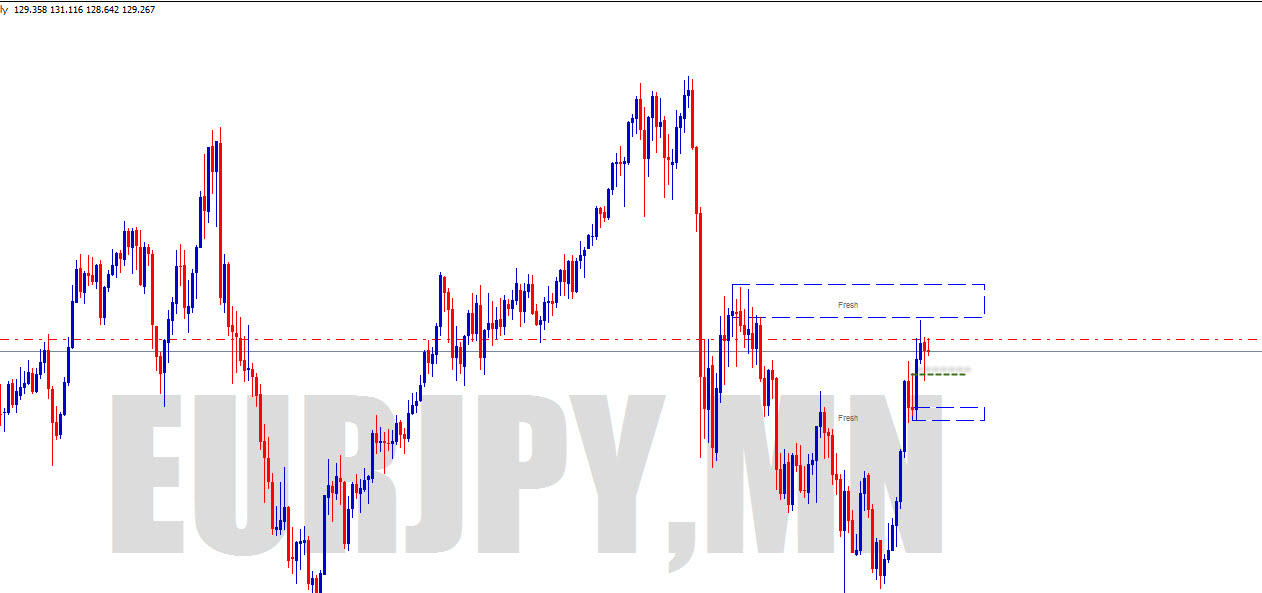
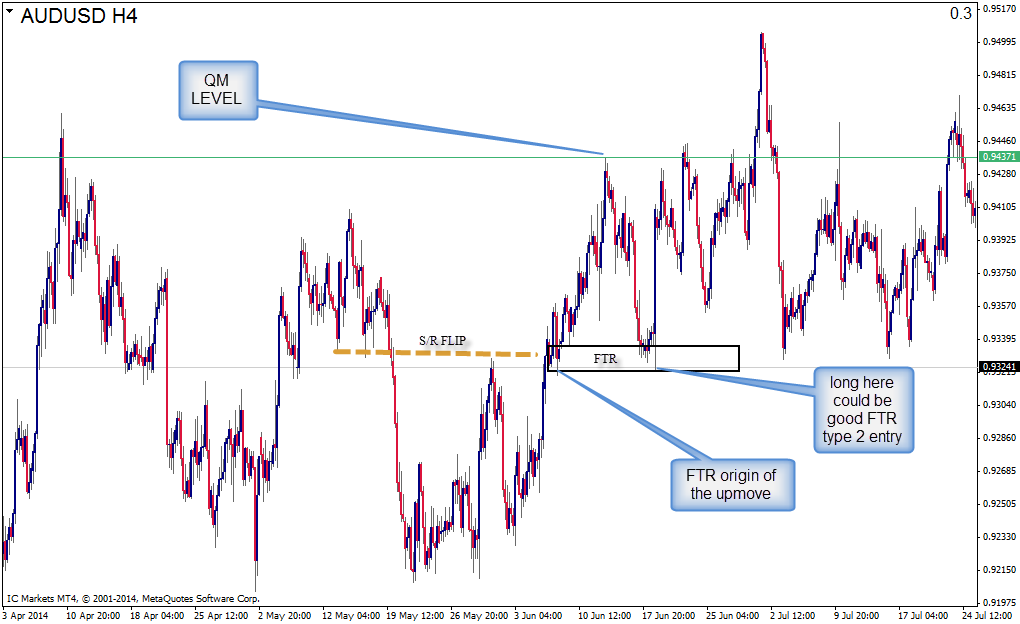
Find a point where price wants to retrace to - a nice DBR or FTR at a Fakeout level is a great candidate. Wait there for price to return - that's your best setup
Find a point where price wants to retrace to - a nice DBR or FTR at a Fakeout level is a great candidate. Wait there for price to return - that's your best setup
I never care about candles though - apart from
pre market opens and pre news setups, I give time no importance at all (and
time is a factor in candles). I rather look for decisions on price - the
failure to return to a zone once broken is one of the most important. for me,
if there's no FTR, there's no FL. They're exactly the same thing. Knowing this
makes reading the market very simple indeed
We place alot of weight on an engulf. Where
price retraces to is very important also. Price moves from FL to FL, so we also place alot of
weight on the break of a FL. It lets price then move into the next zone
As far as S/D goes, your idea is OK, except you
must really forget about reading candles; time doesn't come into the reality of
market movement.
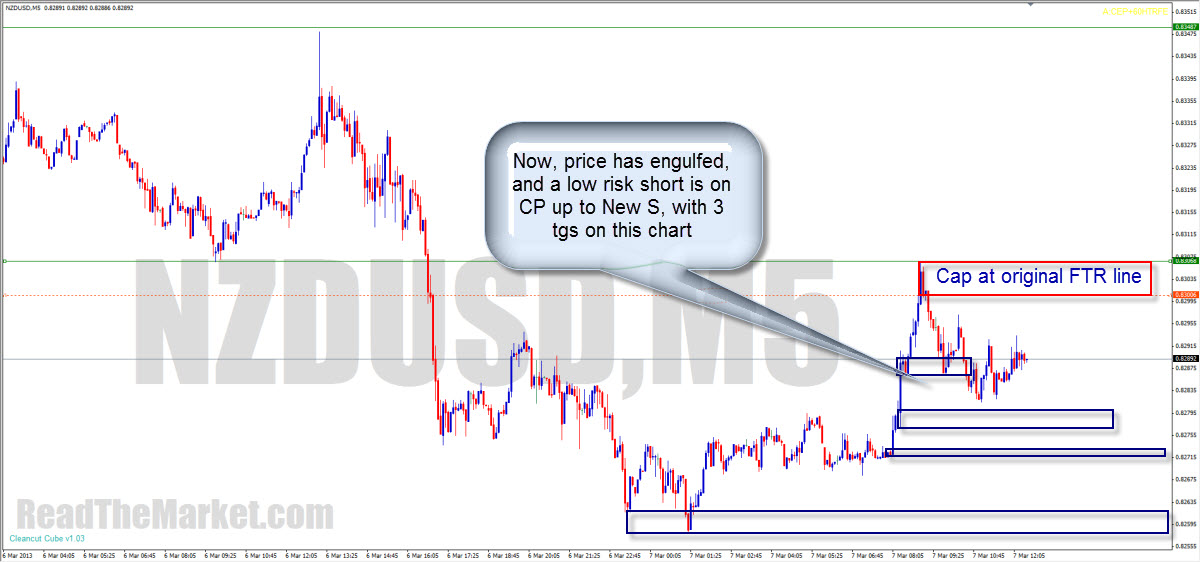
The real PA to look for is an engulf; the sign that price wants the next level. Also, look for them at the edge of the PAZ,
The real PA to look for is an engulf; the sign that price wants the next level. Also, look for them at the edge of the PAZ,
I'll crack up though if I ever read about an
"engulfing candle"! They mean absolutely nothing without the engulf
of a pole base.

Sure IT will correct me if I'm wrong however
for me it's just easier to think about a fake out as price trying to
get to the next real level before reversing, not just breaking structure
highs or lows which are retests. Look left of where price has engulfed. If
it it only breaks s/r but not what the s/r is reacting to, it could be a fake
out
An M1 flag may be engulfed many times before it
reaches its M1 target. Only when it has reached its M1 target does an engulf
actually matter
I see where you're coming from, but I'd like
you to look for FLs which have been engulfed, making new FLs, which have been
engulfed, making new..
Yes, it's about knowing where the retailers'
stops are. It's about knowing where the breakout traders are waiting. It's
about understanding the tricks played to get the retailers chasing their tails. This, in many cases, plays out in price patterns.
But these patterns are created by a set of rules which governs all price
movement, however it ends up looking on a chart. The patterns are the entrance to the rabbit hole;
the visible part. Go deeper and you'll find these rules
https://readthemarket.com/index.php/en/forum/journals/1523-if?start=2550#63387


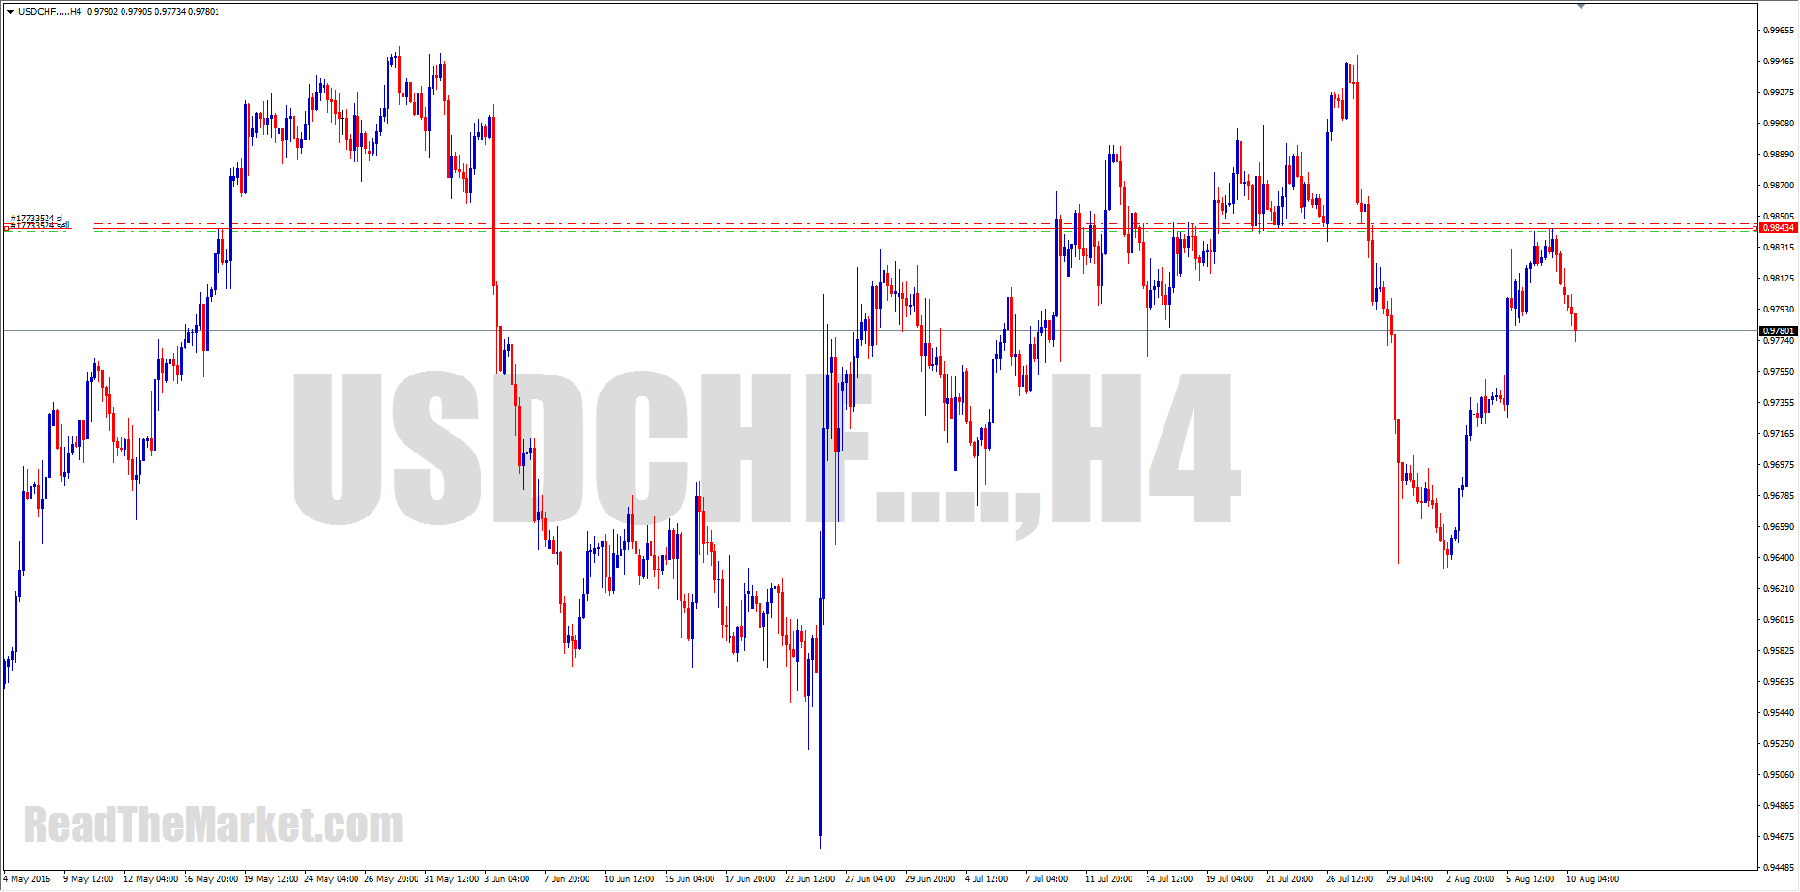
For the moment, here's a price to watch.
But beware. If you consider it a trade call, it WILL fail!!
https://readthemarket.com/index.php/en/forum/journals/1523-if?start=2625#63992

https://readthemarket.com/index.php/en/forum/journals/1523-if?start=2650#64169


https://readthemarket.com/index.php/en/forum/journals/1523-if?start=2650#64175

https://readthemarket.com/index.php/en/forum/journals/1523-if?start=2700#64466As I see it, when they're approaching the line they're told to turn price on, they'll be doing all they can to go flat and reverse.
There is no potential loss, as their bosses are the people who create every currency on the planet, bar three, out of thin air, giving them an unlimited budget for their manipulations.
This unlimited budget also allows them to keep any level they like unbroken
https://readthemarket.com/index.php/en/forum/journals/1523-if?start=2700#64512Right. To answer a PM I got, which was
"Is there any way to know how far will the retrace will happen after the break of the level?"
No.It can retrace to any set of clean orders in the zone it's traveled through.
Ideally it will travel all the way back for a QM at the MPL, or even break the H/L for a DM, but it often only retraces a short way, leaving the clean orders beyond for later.
At each minor level it retraces to, we can take confirmed LTF trades, taking some profits to cover losses, letting some run to the HTF target, should this be the depth of the RT
https://readthemarket.com/index.php/en/forum/journals/1523-if?start=2775#65201

https://readthemarket.com/index.php/en/forum/journals/1523-if?start=2800#65246
This is also good for catching the candlestick traders

https://readthemarket.com/index.php/en/forum/journals/1523-if?start=2800#65248

https://readthemarket.com/index.php/en/forum/journals/1523-if?start=2800#65258

https://readthemarket.com/index.php/en/forum/journals/1523-if?start=2800#65265

https://readthemarket.com/index.php/en/forum/journals/1523-if?start=2800#65266
In fact, a symmetry lover might even see the breaking of C as a potentially big deal

https://readthemarket.com/index.php/en/forum/journals/1523-if?start=2875#66407

https://readthemarket.com/index.php/en/forum/journals/1523-if?start=2950#68223
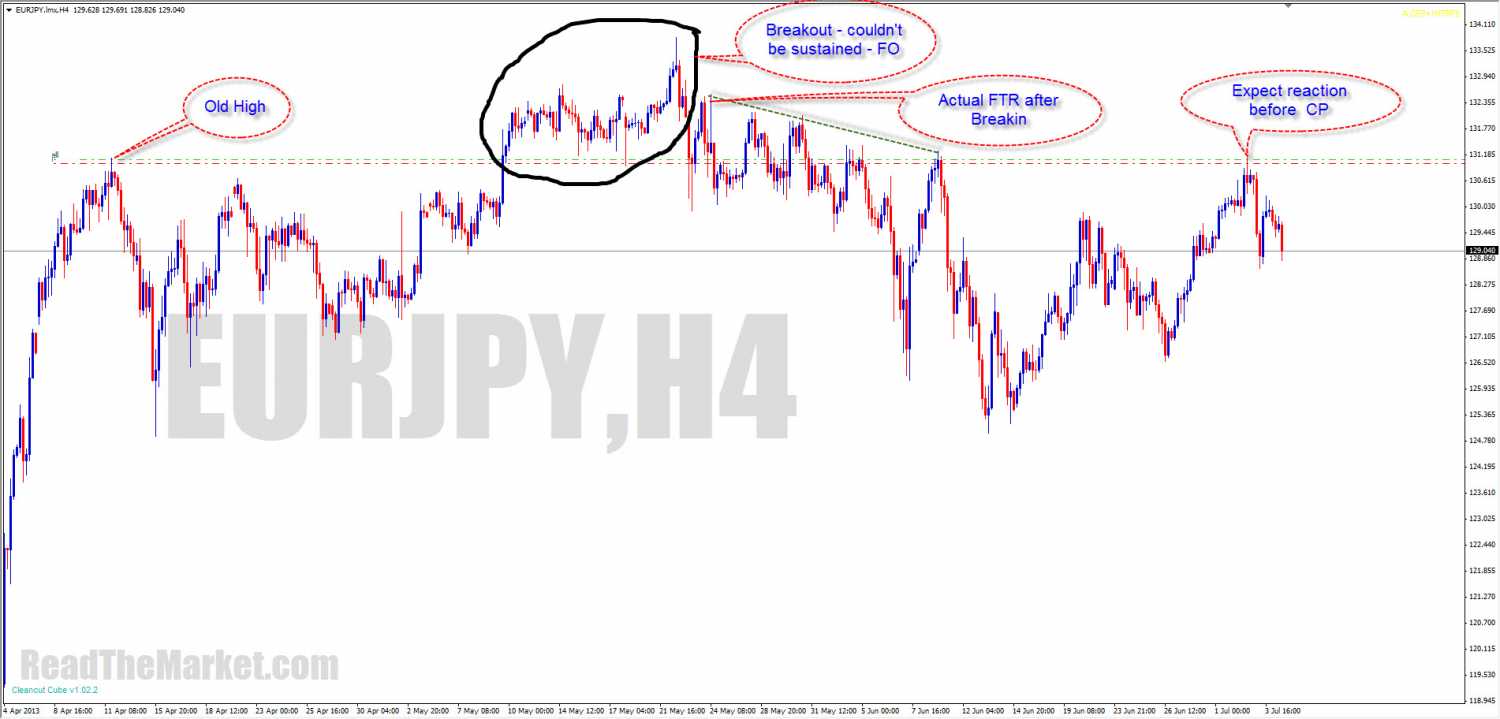
Here's an example of my original interpretation of an FTR

https://readthemarket.com/index.php/en/forum/journals/1523-if?start=3000#68651

https://readthemarket.com/index.php/en/forum/journals/1523-if?start=3050#68802

https://readthemarket.com/index.php/en/forum/journals/1523-if?start=3050#68832

https://readthemarket.com/index.php/en/forum/journals/1523-if?start=3125#69070


Well, that's done for a reason.
If your target is to turn price, then there should be lots of stops and breakout trades there. These are set up by bouncing price early, making what looks like a reversal engulf, retracing to let in all the SD traders, then breaking the fake H/L.
That was easy to anticipate on Loon the other day.
https://readthemarket.com/index.php/en/forum/journals/1523-if?start=3125#69215

https://readthemarket.com/index.php/en/forum/journals/1523-if?start=3125#69285
RS break-in isn't nearly as significant as Flag break

https://readthemarket.com/index.php/en/forum/journals/1523-if?start=3150#69439

https://readthemarket.com/index.php/en/forum/journals/1523-if?start=3175#69613

https://readthemarket.com/index.php/en/forum/journals/1523-if?start=3175#69614

https://readthemarket.com/index.php/en/forum/journals/1523-if?start=3225#69886

https://readthemarket.com/index.php/en/forum/journals/1523-if?start=3225#69897
Twenty such medium trades in a year can pay extremely well!
This is why I only want you guys to take the screamers. It's not at all about quantity of trades. It's about their quality.
Take only the best, and you're set for life
https://readthemarket.com/index.php/en/forum/journals/1523-if?start=3375#71207
It seems then that I said the best places to trade from are the SRKs of FLs, and I also said that the best places to trade from are the MPLs of FLs.
There's no discrepancy there.
There can be two best cars, two best paintings, boobs, whatever you can think of!


Comments
Post a Comment